A Colorado House Bill aiming to update restaurant inspection regulations has Weld County leaders again fighting for local control.
 House Bill 1401, introduced late last week, would ban summarizing inspection results with a letter, number or any other “oversimplified method.”
County leaders overhauled the inspection page online in late 2014. Among the updates was a change in grading. Instead of using ambiguous words to rate a restaurant’s safety level, they began using an A-F system.
“It makes it much easier for the citizens of Weld County to look at a restaurant to see how they’re doing,” said Mike Freeman, chairman of the Board of Weld County Commissioners. “People don’t know what ‘critical’ is.”
The inspection process never changed; state law would forbid that. The update changed only how information was presented to the public.
Although various restaurant owners attended meetings to criticize the rule change, county leaders say they believe the change has been a boon to residents. Not only is the A-F grading system more transparent, it encourages restaurant owners to step up, Freeman said.
“They don’t want to see Ds and Fs,” he said. “It’s a very positive impact.”
Within the last year, Weld County saw 50 percent fewer inspections receiving an F, Environmental Health Director Trevor Jiricek wrote in a letter. Inspections getting either a D or an F dropped to 19 percent from 28 percent.
Web traffic on the new inspection page increased 100 percent over that time, Jiricek wrote. Leaders say it’s because residents can actually glean something from the page now.
The use of restaurant inspection disclosure systems as a means of communicating food safety information
Filion, K. and Powell, D.A. 2009. Journal of Foodservice 20: 287-297.
The World Health Organization estimates that up to 30% of individuals in developed countries become ill from food or water each year. Up to 70% of these illnesses are estimated to be linked to food prepared at foodservice establishments.
Consumer confidence in the safety of food prepared in restaurants is fragile, varying significantly from year to year, with many consumers attributing foodborne illness to foodservice. One of the key drivers of restaurant choice is consumer perception of the hygiene of a restaurant. Restaurant hygiene information is something consumers desire, and when available, may use to make dining decisions.
Filion, K. and Powell, D.A. 2011. Designing a national restaurant inspection disclosure system for New Zealand. Journal of Food Protection 74(11): 1869-1874
The World Health Organization estimates that up to 30% of individuals in developed countries become ill from contaminated food or water each year, and up to 70% of these illnesses are estimated to be linked to food service facilities. The aim of restaurant inspections is to reduce foodborne outbreaks and enhance consumer confidence in food service. Inspection disclosure systems have been developed as tools for consumers and incentives for food service operators. Disclosure systems are common in developed countries but are inconsistently used, possibly because previous research has not determined the best format for disclosing inspection results. This study was conducted to develop a consistent, compelling, and trusted inspection disclosure system for New Zealand. Existing international and national disclosure systems were evaluated.
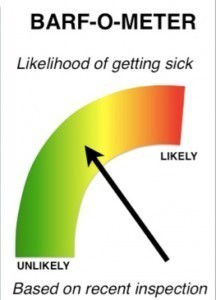
Two cards, a letter grade (A, B, C, or F) and a gauge (speedometer style), were designed to represent a restaurant’s inspection result and were provided to 371 premises in six districts for 3 months. Operators (n = 269) and consumers (n = 991) were interviewed to determine which card design best communicated inspection results. Less than half of the consumers noticed cards before entering the premises; these data indicated that the letter attracted more initial attention (78%) than the gauge (45%). Fifty-eight percent (38) of the operators with the gauge preferred the letter; and 79% (47) of the operators with letter preferred the letter. Eighty-eight percent (133) of the consumers in gauge districts preferred the letter, and 72% (161) of those in letter districts preferring the letter. Based on these data, the letter method was recommended for a national disclosure system for New Zealand.
