FoodNet Canada 2010 annual report

FoodNet Canada tracks enteric diseases (illnesses of the gut) commonly known as food-poisoning, in Canadians and traces them back to their sources, such as food, water and animals. These data are analyzed to help determine which sources are causing the most illness among Canadians and help us to track illnesses and their causes over time.

bureaucrat 2In the 2010 surveillance year, FoodNet Canada was active in two areas: the Region of Waterloo Public Health and the Fraser Health Authority of lower mainland British Columbia (BC). In each location, or “sentinel site”, enhanced human disease surveillance is performed in parallel with active surveillance of the possible sources that ill persons may have been exposed to, to determine if they contain specific bacteria, viruses and parasites that could cause illness in humans.

The following key findings are based on the surveillance data from 2010 in the ON and BC sites. However, no historical comparisons could be made for the BC site since the site was not established until April 2010.

*In the ON site, a higher number of human cases of enteric disease (acquired within the country) were reported in 2010 than in 2009, although rates have remained relatively stable over the last five years for most enteric diseases reported to FoodNet Canada. However, rates of verotoxigenic Escherichia coli (VTEC) infection and yersiniosis have both decreased since 2006.

*Campylobacter jejuni was the most commonly reported enteric disease (acquired within the country) in both sites. It was most commonly found on raw, retail chicken breasts purchased in the ON site. This highlights the importance of safe cooking and food handling practices. Contact with pet dogs was also more commonly reported in people with campylobacteriosis than in people with other reported diseases in both sites. In addition, Campylobacter was found in samples of animal feces collected from participating farms in the ON site. Overall, raw chicken was the most likely source of Campylobacter infection of all tested potential sources.

bureaucrat*Salmonellosis was the second most commonly reported enteric disease (acquired within the country) in both sites with chicken appearing to be a main source for human illness caused by Salmonella. In the ON site, Salmonella was commonly detected in raw chicken and, rarely, in beef and pork. It was also found in fecal samples from broiler chicken, swine, beef, and dairy farms and in untreated surface water. The most common Salmonella subtypes (e.g. Salmonella Enteritidis phage types 8 and 13a) were similar among affected people, retail chicken meat and on chicken farms. In addition, exposure to pet cats was more likely for people with salmonellosis compared to other diseases in both sentinel sites in 2010.

*The rate of VTEC infection increased slightly in 2010 in the ON site (compared to 2009), however, this increase is within the normal variation that we would expect from year to year. Several of the studied exposure factors were reported more often by cases with VTEC infection than by cases with other enteric illnesses, such as eating at a restaurant. These findings highlight areas for further research to better understand potential exposure for infection. VTEC was found in fecal samples collected from beef, dairy, and swine farms in the ON site, as well as in 12 samples of retail ground beef and from untreated surface water. These findings are well known and expected and suggest that multiple sources of E. coli exist. Cattle remain a major source for E. coli O157:H7. Generally, meat products sold in the ON site have had low meat content from the region, due to processors obtaining their meat products from multiple regions of the province and Canada.

*Travel outside of Canada remains an important source of enteric disease in 2010, with 31% of the reported cases from the ON site and 24% of cases from the BC site likely involving infections acquired abroad. This highlights the importance of travel health information for Canadians.


To view the full report, please visit: http://publications.gc.ca/site/eng/461262/publication.html 

New US CDC data on foodborne disease outbreaks

Outbreaks provide important insights into how germs spread, which food and germ combinations cause illnesses, and how to prevent infections. Public health and industry use outbreak data to create information on prevention, education, and policy.

foodborne-disease-data_d250pxCDC has a long history of summarizing outbreak reports from local and state health departments. CDC collects outbreak data and makes it available to the public. Tracking and reporting outbreak data is the first step towards prevention.

Highlights of New Reports:

CDC published two new reports for 2011 and 2012. The data from these reports help show the human impact of foodborne disease outbreaks.

Number and Causes of Outbreaks

*1,632 foodborne disease outbreaks, 29,112 illnesses, 1,750 hospitalizations, and 68 deaths

*793 outbreaks caused by a single, confirmed pathogen

*Most common causes of outbreaks:

*Norovirus: 41% of reported outbreaks

*Salmonella: 25% of reported outbreaks

Number and Causes of Outbreak-Related Illnesses

*18,880 (65%) outbreak-related illnesses caused by a single, confirmed pathogen

*1,501 (8%) resulted in hospitalization

*Most common causes of outbreak-related illnesses:

*Norovirus: 46% of outbreak-related illnesses

Salmonella: 34% of outbreak-related illnesses

Setting of Outbreaks

Among the outbreaks with a single known food preparation setting, foods were prepared most- commonly at or by:

*Restaurants, specifically sit-down dining style restaurants: 60% of outbreaks,

*Caterers or banquet facilities: 13% of outbreaks

*Homes: 13% of outbreaks

Germs and Foods

*Pathogens and foods responsible for the most outbreak-related illnesses, hospitalizations, and deaths in 2012:

*Illnesses

*Salmonella in fruits (446 illnesses)

*Salmonella in fish (425 illnesses)

Salmonella in chicken (345 illnesses)

*Hospitalizations

*Salmonella in chicken (109 hospitalizations)

*Salmonella in fruits (55 hospitalizations)

*Salmonella in fish (55 hospitalizations)

*Deaths

*Listeria in dairy (5 deaths)

*Campylobacter in chicken (4 deaths)

*Among the 192 outbreaks attributed to a food composed of ingredients from a single food category, the categories most often implicated:

*Fish (16%)

*Vegetable row crops (12%)

*Dairy (10%, nearly all unpasteurized)

Campylobacter Outbreaks on the Rise since 2009

The number of outbreaks caused by Campylobacter increased from 15 outbreaks in 2009 to 25 in 2010, 30 in 2011, and 37 in 2012. During 2011 and 2012, 37 outbreaks were linked to foods; unpasteurized (raw) milk was responsible for the largest number of outbreaks.

Australian livestock industries in ‘favorable position’ on antibiotic use

Australia’s first national survey suggests livestock industries have, according to the Bush Telegraph, done a relatively good job of limiting the use of antibiotics.

The survey of 2,600 samples collected through 22 veterinary laboratories around Australia shows a low level of resistance to antibiotics.

ab.use.pigs.austThe labs tested for antibiotic resistance within two types of pathogens – E. coli and Golden Staph (Staphylococcus).

The survey found no resistance to carbapenems, an antibiotic class of last resort in human medicine used against infections when other antibacterial treatments have failed.

However the study identified ‘very low’ frequencies of resistance to other critically important human antimicrobials including fluoroquinolones and 3rd generation cephalosporins.

Professor John Turnidge, senior medical adviser on the Australian Commission on Safety and Quality in Health Care, says “what’s encouraging is the levels of resistance to the critical antibiotics for human health are close to zero.

“In part it’s due to the fact that by good foresight, good management, or good luck about 20 years ago for one particular class of antibiotics, we made a decision at a federal level that these shouldn’t be available for use in food animals and I think we’re reaping the benefit of that now.

“I’m embarrassed to say they (livestock industries) have been doing a better job than the human side.”

Salmonella in Seattle at retail

Poultry have been identified as one of the major sources of salmonellosis, with estimates ranging from 10 to 22% of total cases.

Despite several advances in the industry and new performance standards, the incidence of salmonellosis in the population has not declined over the last 15 years. Salmonella is pervasive in a wide variety of foods, and thus, estimating its burden resulting from specific food categories has been challenging and plagued with uncertainty seattle3due to critical data gaps. The objective of this study was to conduct a year-long market survey (1,322 samples) to help bridge the data gaps on the contamination rates and levels of Salmonella on raw poultry by product type (i.e., breast, thighs, drums, wings, and split breast) and production method (conventional versus organic).

The isolates recovered were serotyped and tested for antibiotic sensitivities. A PCR method was utilized for initial screening of samples after an overnight enrichment in tryptic soy broth. Three-tube most-probable-number (MPN) assays and anti-Salmonella immunomagnetic separation methods were utilized to determine the levels of Salmonella and aid with the recovery of Salmonella species, respectively. Eleven percent of the samples were positive for Salmonella. Significant differences in percent positive rates by product type included up to a 4-fold difference in percent positive rates between establishments, ranging from 7 to 31%.

Of the samples positive for Salmonella species, 94% had <30 MPN/100 g. Production methods identified as organic or as not using antibiotics had significantly higher rates of recovery of Salmonella. On the other hand, all of the Salmonella isolates that were resistant to two or more antibiotics originated from conventional processing establishments where antibiotics were utilized. In addition, a significant proportion of isolates from conventionally processed products were serotypes clinically relevant to humans.

Prevalence, concentrations, and antibiotic sensitivities of Salmonella serovars in poultry from retail establishments in Seattle, Washington

Journal of Food Protection, Number 6, June 2014, pp. 872-1042, pp. 885-893(9)

Mazengia, E., Samadpour, M., Hill, H. W., Greeson, K., Tenney, K., Liao, G., Huang, X., Meschke, J. S.

http://www.ingentaconnect.com/content/iafp/jfp/2014/00000077/00000006/art00003

Hey kids, the snails are back: CDC releases 2013 FoodNet data

That’s the tagline from a Far Side cartoon and what immediately came to mind upon reading yet again that reductions in foodborne illness were stagnant for 2013.

There were successes, failures and shifting profiles of what foods lead to foodborne illness, because whatever Americans choose to eat, under whatever production system, some smart bug is going to figure out how to flourish.

And the FoodNet data remains the best and most publicly available surveillance data in the world; that’s right, best in the world.

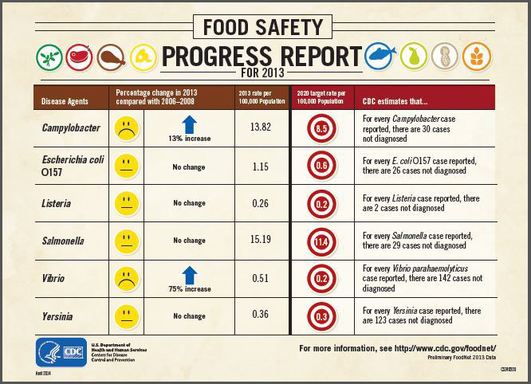
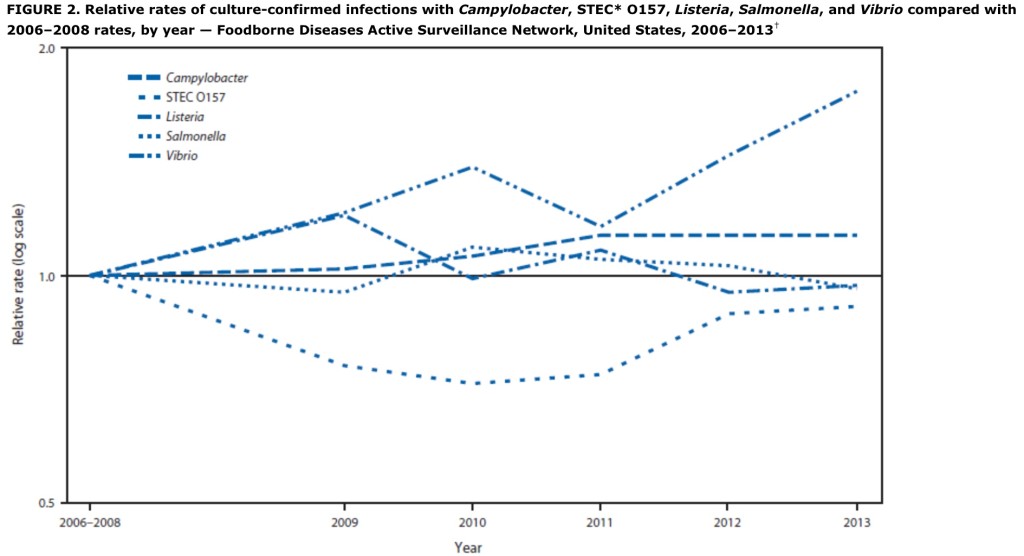
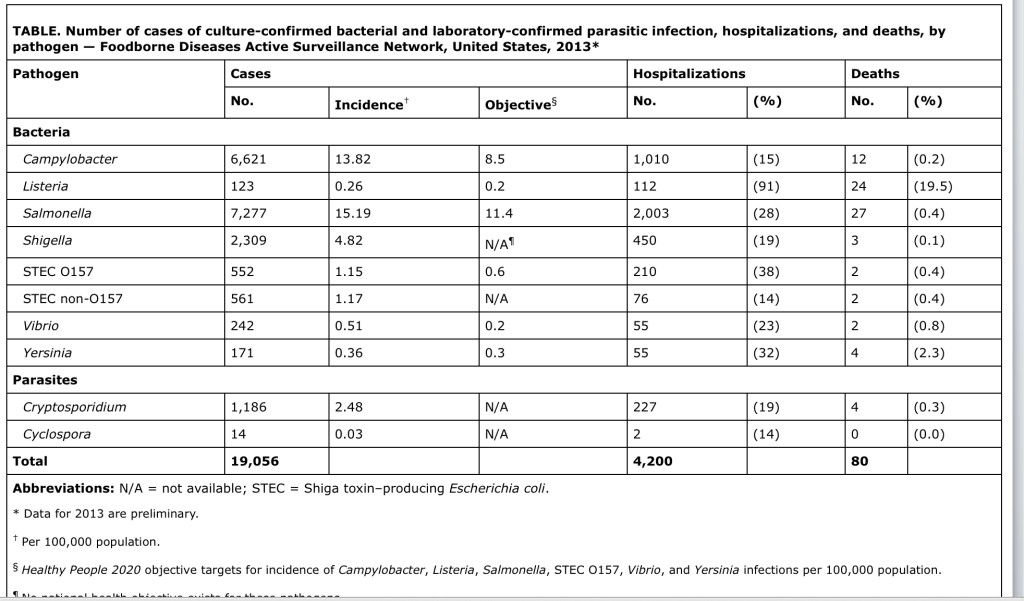
The Foodborne Diseases Active Surveillance Network (FoodNet) monitors the incidence of laboratory-confirmed infections caused by nine pathogens transmitted commonly through food in 10 U.S. sites, covering approximately 15% of the U.S. population. This report summarizes preliminary 2013 data and describes trends since 2006. In 2013, a total of 19,056 infections, 4,200 hospitalizations, and 80 deaths were reported. For most infections, incidence was well above national Healthy People 2020 incidence targets and highest among children aged <5 years. Compared with 2010–2012, the estimated incidence of infection in 2013 was lower for Salmonella, higher for Vibrio, and unchanged overall. Since 2006–2008, the overall incidence has not changed significantly. More needs to be done.

Yes, more needs to be done. Part of that involves abandoning archaic communications and invoking current, compelling and credible food safety messages using a variety of media, at the places where people make food decisions – whether it’s the local market or the megalomart.

cdc.fbi.annual.13The complete report is available at http://www.cdc.gov/mmwr/preview/mmwrhtml/mm6315a3.htm?s_cid=mm6315a3_e

Incidence and trends of infection with pathogens transmitted commonly through food — Foodborne Diseases Active Surveillance Network, 10 U.S. sites, 2006–2013.

CDC MMWR 63(15);328-332

Stacy M. Crim, Martha Iwamoto, Jennifer Y. Huang, Patricia M. Griffin, Debra Gilliss, Alicia B. Cronquist, Matthew Cartter, Melissa Tobin-D’Angelo, David Blythe, Kirk Smith, Sarah Lathrop, Shelley Zansky, Paul R. Cieslak, John Dunn, Kristin G. Holt, Susan Lance, Robert Tauxe, Olga L. Henao

cdc.foodnet.13

1-in-8 new Canadian estimate of annual foodborne illness rate

For years it was 1-in-4.

One out of every four people would get sick from the food and water they consumed every year in the U.S., culminating in the 76 million sick people per year.

burden.foodborne.reportingThe Canadians and Australians eventually did their own estimates and came up with 1-in-3.

Then the Americans revised their number to 1-in-6, or 48 million people barfing per year.

Now the Canadians have revised their number to 1-in-8.

This doesn’t mean food is safer or worse, just that better estimates make more accurate estimations – and these are still vast estimations.

The Public Health Agency of Canada estimates that each year roughly one-in-eight Canadians (or four million people) get sick due to domestically acquired food-borne diseases. This estimate provides the most accurate picture yet of which foodborne bacteria, viruses, and parasites are causing the most illnesses in Canada, as well as estimating the number of foodborne illnesses without a known cause.

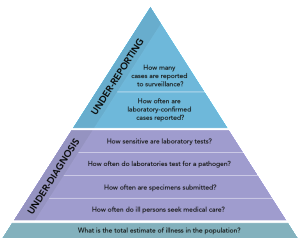
In general, to be captured in a Canadian surveillance system, a sick individual must: seek care; have a sample (stool, urine or blood) requested; and submit a sample for testing. In addition, the sample must be tested with a test capable of identifying the causative agent; and finally the positive test result must be reported to the surveillance system. Surveillance systems only capture a small portion of total illnesses given all these necessary steps (i.e. there is under-diagnosis and under-reporting taking place). 

Better zoonoses surveillance needed in Nepal

A team of scientists from Belgium, Nepal, New Zealand, Switzerland and the Netherlands report in a study titled ‘The Burden of Parasitic Zoonoses in Nepal: A Systematic Review’ that the country needs a better surveillance system to accurately estimate animal-borne parasitic disease or ‘parasitic zoonoses (PZs)’.

The recent study estimates the public health burden of PZs in Nepal at 24,000 healthy pork tapewormsyears lost annually.

Neurocysticercosis caused by pork tapeworms affect the nervous system, cystic echinococcosis traced through dog tapeworms and congenital toxoplasmosis in which mothers infected with the toxoplasma parasite give birth to infected children, are the three top PZs in Nepal, according to the study.

The study estimates that Nepal loses 14,268 healthy years annually due to neurocysticercosis, 9,255 years due to congenital toxoplasmosis, and 251 due to cystic echinococcosis. Numerous data sources were analysed in the study to examine the relevance and importance of such infections.

“Nepal is considered endemic for at least 10 PZs, and might be endemic for seven others. Most of these diseases probably only have a small public health impact. However, neurocysticercosis and congenital toxoplasmosis are likely to impose an important burden to public health,” said the report.

Good news, bad news: EU Campy and Salmonella illnesses drop, Listeria increases

The constant public health quest is to stay ahead of the bugs by making risk management decisions. With all the focus on pathogen reduction, CDC reported last year that raw numbers show decreases in Salmonella, E.coli O157, Listeria and Yersinia infections and significant increases in Campylobacter and Vibro illnesses (compared to 2006-2008). GoodNewsBadNews

EFSA using similar methods, released information today that shows an increase in Listeria with decreases in Salmonella and Campylobacter in the EU.

Campylobacteriosis is still the most reported disease, accounting for 214,000 cases of infections.

“It is encouraging to see that cases of campylobacteriosis have gone down in 2012. But more investigation and monitoring is needed to see if this is the beginning of a trend”, said Marta Hugas, Acting Head of EFSA’s Risk Assessment and Scientific Assistance Department.

Over the years, salmonellosis has been decreasing- with 91,034 reported cases in 2012. This is mainly due to the successful Salmonella control programmes put in place by EU Member States and the European Commission in poultry, the report said. Most Member States met their Salmonella reduction target for poultry flocks.

Listeriosis accounted for 1,642 reported cases, 10.5% more than in 2011 and has been gradually increasing over the past five years.

From 8 to 1: US shutdown hampers foodborne illness tracking

The U.S. government shutdown is, according to NPR, pushing the nation’s food safety system to its limits.

There is normally a team of eight people overseeing Pulsenet, the critical foodborne illness tracking database. Centers for Disease Control Director Tom Frieden said pulsenetpost-shutdown, there’s only one. Some research and reference labs have gone from a staff of 80 to 2, and staff at the 20 quarantine stations dotted along the country’s borders and ports has been reduced by 85 percent.

The CDC is currently monitoring about 30 clusters of foodborne illnesses around the country, which is typical at any given time. About half the CDC staffers involved in surveillance and outbreak response have also been furloughed.