After being infected with E. coli for the second time in her life, a Seattle woman wants to make restaurant inspection reports in Washington as public as possible, modeling efforts in New York and California.
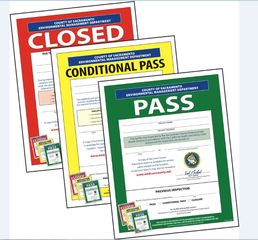
Sarah Schacht told KING 5 News she likes what is happening in San Francisco, where health scores and violations for every restaurant are now  posted on the popular website Yelp.
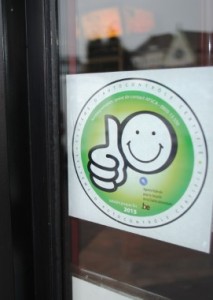
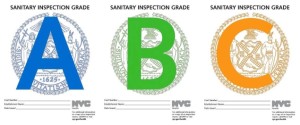
She also likes the approach in New York and some other major cities, where inspection grades of “A,” “B” and “C” are on display in restaurant windows.
“That’s immediately useful,” she said. “It’s intuitive, it tells customers what they need to know just by walking by.”
Schacht was 13 years old when she and her family were among the hundreds of people sickened by an E. coli outbreak at Jack in the Box restaurants in 1993.
Schacht was infected again this February and is now suing the Central District restaurant that she believes is responsible.
Food-safety attorney Bill Marler represented Schacht in both cases.
“This is the first time I’ve ever had a case of a sort-of repeat customer,” Marler said.
Schacht and another woman have filed a lawsuit against Ambassel Ethiopian Restaurant.
Before dining out in February, Schacht did not know that Ambassel had  earned “unsatisfactory” marks on five out of six previous health inspections.
“For me, it would’ve raised some questions and perhaps would’ve influenced the restaurant I would’ve gone to that night,” she said.
Those restaurant inspections are readily available on the King County website for anyone who seeks them out. But Schacht, who is an expert in open government, feels the information is not totally intuitive or easy to understand. She feels users could be confused by the point system because high scores are bad.
“The information is pretty dense and it’s not very user-friendly,” she said.
That is why she prefers the more public approaches in New York and San Francisco.
She’s right.
Filion, K. and Powell, D.A. 2009. The use of restaurant inspection disclosure systems as a means of communicating food safety information. Journal of Foodservice 20: 287-297.
The World Health Organization estimates that up to 30% of individuals in developed countries become ill from food or water each year. Up to 70% of these illnesses are estimated to be linked to food prepared at foodservice establishments. Consumer confidence in the safety of food prepared in restaurants isfragile, varying significantly from year to year, with many consumers attributing foodborne illness to foodservice. One of the key drivers of restaurant choice is consumer perception of the hygiene of a restaurant. Restaurant hygiene information is something consumers desire, and when available, may use to make dining decisions.
Designing a national restaurant inspection disclosure system for New Zealand
01.nov.11
Journal of Food Protection 74(11): 1869-1874
The World Health Organization estimates that up to 30% of individuals in developed countries become ill from contaminated food or water each year, and up to 70% of these illnesses are estimated to be linked to food service  facilities. The aim of restaurant inspections is to reduce foodborne outbreaks and enhance consumer confidence in food service. Inspection disclosure systems have been developed as tools for consumers and incentives for food service operators. Disclosure systems are common in developed countries but are inconsistently used, possibly because previous research has not determined the best format for disclosing inspection results. This study was conducted to develop a consistent, compelling, and trusted inspection disclosure system for New Zealand. Existing international and national disclosure systems were evaluated. Two cards, a letter grade (A, B, C, or F) and a gauge (speedometer style), were designed to represent a restaurant’s inspection result and were provided to 371 premises in six districts for 3 months. Operators (n = 269) and consumers (n = 991) were interviewed to determine which card design best communicated inspection results. Less than half of the consumers noticed cards before entering the premises; these data indicated that the letter attracted more initial attention (78%) than the gauge (45%). Fifty-eight percent (38) of the operators with the gauge preferred the letter; and 79% (47) of the operators with letter preferred the letter. Eighty-eight percent (133) of the consumers in gauge districts preferred the letter, and 72% (161) of those in letter districts preferring the letter. Based on these data, the letter method was recommended for a national disclosure system for New Zealand.
 Officers reported seeing a “hail of garbage” fall from a fifth story apartment in downtown Seattle Sunday morning.


.jpg) He chose the cooked kind.
He chose the cooked kind..jpg) considered "red critical." The inspections covered an eight-month period of roughly 40 markets.
considered "red critical." The inspections covered an eight-month period of roughly 40 markets.