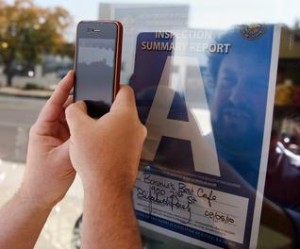
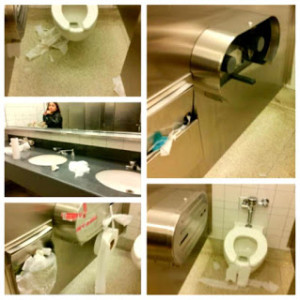
Stephanie K. Baer of The San Gabriel Valley Tribune writes, it wasn’t long ago when Los Angeles County health inspectors relied on handwritten reports manually filed in boxes to keep track of which restaurants they needed to inspect.
 “LA County got a late start on data management,” said Terri Williams, acting director of the county Department of Public Health’s environmental health division, which is responsible for inspecting more than 39,000 retail food facilities in the county between one and three times a year.
Now, more than two years after implementing Envision Connect, a data management system that tracks inspection data for retail food facility, food truck, housing, and swimming pool inspections, county health officials are beginning to analyze inspection data for food safety trends to help restaurants reduce the risk of foodborne illness.
They plan to meet with representatives from Chipotle in February to discuss trends at the food company’s more than 80 locations in the county as part of a pilot program aimed at helping restaurant operators improve food safety procedures.
“We’re in a position to help them help themselves too, so working together on a positive approach rather than just saying we’re going to call you in for a hearing or we’re going to tack on another inspection,” Williams said, adding the health department would like to continue the program with other large chains.
While Los Angeles County’s data analysis efforts are still in their infancy, other agencies have developed new, innovative strategies to protect consumer health at restaurants.
In Chicago, the city’s Innovation and Technology Department created an algorithm in 2014 that uses data to predict which of the city’s 15,000 food establishments are going to have critical violations, like food temperature issues or vermin infestations.
 The system looks at different variables, like nearby garbage and sanitation complaints, and past inspection results to create a list of the most likely violators.
“The predictions are focused on what we call canvas inspections ‑ where am I going to send my inspectors,” said Chicago’s Chief Data Officer Tom Schenk, “What we’ve done is extract data available on (the city’s) data portal and apply analytics on top of that.”
The city also uses a tool that tracks tweets geocoded to Chicago about people complaining of food poisoning symptoms and then sends the user information about how to report their condition to the health department so it can investigate the restaurant where the person believes they got sick.
The City of Toronto, which developed its own data management system in 2001, has used inspection data to dictate food safety policy and target specific areas in the city where restaurants are experiencing similar health risks, like a cockroach or rodent infestation, said Sylvanus Thompson, Associate Director of Toronto’s food safety program.
“We can use the data to show what section of the city is in more compliance,” Thompson said, referring to an inspection map the city posts on its website.
Similar to what Los Angeles County is working toward, the city will also run reports to track the most common infractions and share that information with local restaurant associations to help them improve.
Williams said she would like to pursue strategies adopted in Chicago and Toronto, but added that the county still doesn’t have enough data to best implement them.
“I’m a big fan of data and making data-driven decisions, but you’ve got to make sure you have good data and you know what you’re doing,” she said. “We just started collecting this data.”
 Alomigir Qureshi, 47, was also sentenced for employing an illegal immigrant at his Chai Wallah restaurant on Yarm High Street and for breaching a suspended sentence he received in 2013 – also for employing failed asylum seekers.


