Maybe IBM is good at some stuff: Grocery scanner data to speed investigations during early foodborne illness outbreaks

Foodborne illnesses, like salmonella, E. coli and norovirus infections, are a major public health concern affecting more than one out of six Americans each year, according to the Centers for Disease Control and Prevention (CDC)1. During a foodborne illness outbreak, rapidly identifying the contaminated food source is vital to minimizing illness, loss and impact on society.

ibm.nerdsToday, IBM Research – Almaden announced its scientists have discovered that analyzing retail-scanner data from grocery stores against maps of confirmed cases of foodborne illness can speed early investigations. In the study, researchers demonstrated that with as few as 10 medical-examination reports of foodborne illness they can narrow down the investigation to 12 suspected food products in just a few hours.

In the study, researchers created a data-analytics methodology to review spatio-temporal data, including geographic location and possible time of consumption, for hundreds of grocery product categories. Researchers also analyzed each product for its shelf life, geographic location of consumption and likelihood of harboring a particular pathogen – then mapped the information to the known location of illness outbreaks. The system then ranked all grocery products by likelihood of contamination in a list from which public health officials could test the top 12 suspected foods for contamination and alert the public accordingly.

A traditional investigation can take from weeks to months and the timing can significantly influence the economic and health impact of a disease outbreak. The typical process employs interviews and questionnaires to trace the contamination source. In 2011, an outbreak of E. coli in Europe took more than 60 days to identify the source, imported fenugreek seeds. By the time the investigation was completed, all the sprouts produced from the seeds had been consumed. Nearly 4,000 people became ill in 16 countries and more than 50 people died before public health officials could pinpoint the source, according to the European Food Safety Authority2.

“When there’s an outbreak of foodborne illness, the biggest challenge facing public health officials is the speed at which they can identify the contaminated food source and alert the public,” said Kun Hu, public health research scientist, IBM Research – Almaden in San Jose, Calif. “While traditional methods like interviews and surveys are still necessary, analyzing big data from retail grocery scanners can significantly narrow down the list of contaminants in hours for further lab testing. Our study shows that Big Data and analytics can profoundly reduce investigation time and human error and have a huge impact on public health.”

Already, the method in this study has been applied to an actual E.  coli  illness outbreak in Norway. With just 17 confirmed cases of infection, public health officials were able to use this methodology to analyze grocery-scanner data related to more than 2,600 possible food products and create a short-list of 10 possible contaminants. Further lab analysis pinpointed the source of contamination down to the batch and lot numbers of the specific product – sausage.


Show me the data: FSIS to begin posting location-specific food safety data online

The U.S. Department of Agriculture’s (USDA) Food Safety and Inspection Service (FSIS) will soon begin sharing new levels of food safety data specific to slaughter and processing facilities in the United States, on Data.gov.

dataThe agency has detailed its framework for releasing this data in its Establishment-Specific Data Release Plan, which the agency anticipates will allow consumers to make more informed choices, motivate individual establishments to improve performance, and lead to industry-wide improvements in food safety by providing better insights into strengths and weaknesses of different practices.

“FSIS’ food safety inspectors collect vast amounts of data at food producing facilities every day, which we analyze on an ongoing basis to detect emerging public health risks and create better policies to prevent foodborne illness,” said USDA Deputy Under Secretary for Food Safety Al Almanza. “Consumers want more information about the foods they are purchasing, and sharing these details can give them better insight into food production and inspection, and help them make informed purchasing decisions.”

FSIS employs roughly 7,500 food safety inspectors who work in more than 6,000 meat, poultry and processed egg facilities across the country and more than 120 ports of entry every day. Over the past seven years, the agency has taken an increasingly data-driven approach to identifying and preventing food safety concerns, and the data these men and women collect in regulated facilities every day have made it possible for FSIS to implement significant food safety changes since 2009. More information about these efforts to modernize food safety inspection can be found at www.Medium.com/USDA-Results. Between 2009 and 2015, this work led to a 12 percent drop in foodborne illness associated with FSIS-regulated products.

The new datasets will begin to publish on Data.gov on a quarterly basis starting 90 days after publication in the Federal Register. Initially, FSIS will share information on the processes used at each facility, giving more detail than is currently listed in the searchable establishment directory, as well as a code for each facility that will make it easier to sort and combine future datasets by facility. Additionally, FSIS will release results for Listeria monocytogenes (Lm) and Salmonella in ready-to-eat (RTE) products and processed egg products.

On a quarterly basis, FSIS will then begin to share other datasets, including results for Shiga Toxin-producing Escherichia coli(STEC) and Salmonella in raw, non-intact beef products; results for Salmonella and Campylobacter in young chickens and young turkeys, comminuted poultry, and chicken parts; routine chemical residue testing data in meat and poultry products; and advanced meat recovery testing data.

Criteria such as data availability and possible impact on public health will be considered by FSIS to determine which datasets are best suited for future public release. User guides that provide context to the data will be included with each dataset.

“This plan is another step toward better engagement with our stakeholders and they will now have quality information on an ongoing basis,” stated USDA Deputy Under Secretary for Food Safety Al Almanza.

The Establishment-Specific Data Release Plan was developed in response to the President Obama’s call for increased data sharing and greater transparency under the Open Government Plan by the Office of Management and Budget (OMB). Beginning in 2010, FSIS consulted with various stakeholder groups, including the National Advisory Committee on Meat and Poultry Inspection Subcommittee on Data Collection, Analysis, and Transparency and the National Research Council on this issue. With the expertise of these organizations, FSIS developed its plan that will not only provide consumers with the opportunity to make more informed choices, but make data publicly available that could yield valuable insights that go beyond the regulatory uses for which the data were collected.


Market microbial food safety: New Australian app to electronically trace meat from paddock to checkout

Developers of a new smartphone application say the app will make it possible to electronically trace livestock from the paddock through the saleyards, abattoirs and eventually the checkout.

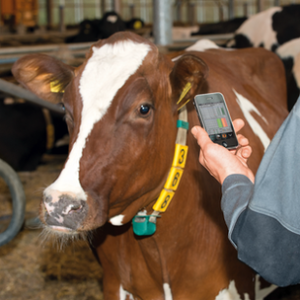
star.trek.tricorderThe new software, developed by Aglive and supported by Meat and Livestock Australia, digitally records information throughout the animal’s life, such as on-farm chemicals used and vaccinations.

It is aimed at bolstering Australia’s reputation for food safety.

Aglive director Paul Ryan said most of the information was currently recorded on paper, but using a smartphone or tablet in conjunction with a hand-held scanner would revolutionise the process.

“The problem [right now] is, there is a digital information gap on farms,” Mr Ryan said.

“The quality assurance systems on farms at the moment that are required to allow farmers’ product to enter into domestic and export markets are paper-based.

cattle.data.smartphone“There is no integrated digital solution to capture and validate the data on farms and allow that data to be shared across the supply chain.”

The next step is to make that information available to consumers. Like the best restaurants, the best producers have nothing to hide and will reveal internal testing results.

Disney opens its food-safety secrets on Zebra devices

It was the end of Sept. 2007 when I got an invite to check out behind-the-scenes food safety activities at several Disney World kitchens at the resort in Florida.

ct-zebra-technologies-disney-bsi-photo-20160301I was blown away.

The Chicago Tribune reports that now, a Chicago-area company will help bring the technology that Disney uses to keep its food safe to a variety of food-service providers.

Disney serves more than 81 million meals a year at its American theme parks and resorts, using custom software on a mobile device that can track milk from the point it’s collected from the cow to when it becomes a Mickey-shaped ice cream bar.

Disney and partners including Lincolnshire-based Zebra Technologies announced this week that its tools are available to anyone in the food-service industry.

High-profile food-safety fails like Chipotle’s have forced restaurants to snap to attention.

“I would say there’s definitely a growing demand,” said Pat Glennon, North American vice president of retail and hospitality for Zebra Technologies. “You’re taking it from pen-and-pencil record keeping to online, immediate tracking of food items from farm to fork, which is necessary as we move forward.”

Glennon said clients can use the software-hardware solution to better comply with food safety regulations.

Zebra Technologies provides the hardware, which runs software built by Baltimore-based iCertainty on Zebra’s Android mobile computers. Restaurant workers use temperature probes that connect wirelessly to the mobile devices to track food throughout the preparation process. They also use the installed Disney Chefs app to catalog details such as whether employees wash their hands frequently.

frank.doug.manhattanDisney uses almost 900 Zebra MC40 devices in more than 700 locations across the world, a Zebra spokeswoman said. She said Disney usually uses one device at each of its restaurant locations and is still ordering devices for a worldwide rollout. The Chefs app can run on any Android device, of which the Zebra MC40 is one option.

Disney is for the first time licensing the system it built more than six years ago with iCertainty to outside restaurants and chains, including Bloomin’ Brands, owner of Outback Steakhouse and Bonefish Grill, and Texas Roadhouse. Roy’s Chicago, at 720 N. State St., also is a customer, the Zebra spokeswoman said. Pricing varies based on client needs.

“Whether it’s food safety or ride safety, we’ve long been active in ways to enhance safety,” a Disney spokeswoman said. “We’re happy to share our best practices that can help others improve safety at their organizations.”

Regulators mount up: raw milk producers aim to regulate themselves

I don’t care who does the regulating as long as the data is public, verifiable and producers are liable. There are benefits and faults with the many systems out there that could be largely remedied with public access to data and marketing of microbial food safety at retail.

colbert.raw.milkAnd I’m sure the raw milk producers promoting self-regulation would have no problem with genetically engineered foods, meat and restaurants being self-regulated.

At least I’m consistent.

Deena Prichep of NPR’s The Salt reports that Mark McAfee, the CEO of Organic Pastures, California’s largest raw milk dairy has founded the Raw Milk Institute.

“People are searching for local raw milk,” McAfee explains. “But when they go to the farm, or they go to the store, they really don’t know what they’re getting.”

To create both accountability and transparency, McAfee worked with epidemiologists, biologists and other health professionals to create RAWMI’s standards. Instead of just focusing on the end results, like bacteria levels, they also worked up detailed protocols for the entire process — from taking the temperature of the dishwasher used to clean the milk bottles to the distance between the water well and manure pile.

The group is also looking at the risk specific to each farm, whether it’s a muddy slope with three cows in Oregon or a sunny California farm with a midsize herd.

When a farm completes its hazards analysis, planning and testing — and passes a site visit from RAWMI — it is listed on the institute’s website. Right now there are half a dozen farms listed, with 10 more in the midst of the process.

The first farm to be listed was Champoeg Creamery, a small dairy about 30 miles south of Portland, Ore. Owner Charlotte Smith is a fifth-generation farmer. But when she first started producing raw milk a few years ago, she discovered it was an entirely different animal.

“I could call the extension office, and get some help on what was going on with my vegetables, or what is this beetle eating my tomatoes,” says Smith. “But there’s no one that will help you with raw milk production.”

And with about 100 families buying her milk — and monitoring an E. coli outbreak at a neighboring farm that landed kids in the hospital — Smith was committed to getting it right. Because while Smith says raw milk may offer health benefits, she also acknowledges the very real dangers.

“You can bring home a chicken and sell the eggs, and feel pretty safe about it. But raw milk, coming out of a cow, and manure flying during milking time — it is a huge challenge, far different than any other farm animal we have.”

As someone looking for guidance, Smith was a bit surprised that national regulatory agencies wouldn’t lend their expertise to establishing safety criteria. To them, she says:

“Raw milk is here to stay, whether you want to admit it or not. So why not work together, come up with some very basic things, where if you’re going to produce and sell raw milk, you’re going to agree that you have met these standards. In my mind, it seems so easy.”

Robert Tauxe at the Centers for Disease Control and Prevention says that while the safety plans and regular testing advocated by RAWMI can certainly reduce the risk of bacterial contamination, they can’t offer any certainty that the particular gallon you grab from the shelf is truly safe.

“A cow can test negative today, and then get infected tomorrow,” notes Tauxe.

Tauxe is not unsympathetic to the reasons people seek out raw milk. “I understand the interest in having colonies of living bacteria in the food we eat,” he says. “The problem is when those living bacteria that are beneficial get mixed up with the living bacteria that cause disease.”

The sample has been taken, the results are in: now what?

My friend Margaret Hardin, vice president of technical services at IEH Laboratories & Consulting Group wrote an excellent column for Food Safety Magazine this month. Excerpts below:

6714HardinMargaret We spend a considerable amount of our time in the food industry collecting data. Data may be quantitative or qualitative, and may be the result of one or more of numerous methodologies from an air settling plate or a swab to the analysis of a sample using high-performance liquid chromatography for the presence/absence of a chemical of concern. Data could also be from microbial mapping using molecular methods such as genetic fingerprinting.

Data are generally the results of measurements, either objective or subjective, which are designed to evaluate the subject matter in a multitude of ways: sensory, physical, chemical, microbiological or particulate. Such information may be obtained to develop and/or verify raw product specifications (ingredients, supplies, water or air) as well as track suppliers, monitor employee hygiene and/or the processing environment to verify sanitation, develop and verify product shelf life, validate products and processes, or verify finished product food safety and quality specifications.

You have gone to all the trouble and expense to develop objectives, outline the plan, decide where and how to take the sample, evaluate the best available, cost-effective method to employ to test the sample, chosen a laboratory to analyze the sample and then waited for the results, oftentimes with a truck at the loading dock or a vice-president on the phone. The results are in, and the worst thing you can do now is to put those results away in a drawer or store them away on the hard drive. The best thing you can do is to put the data to work for you.


star-trek-dataHopefully, you thought ahead and made wise decisions before you even took the sample so that the results would be meaningful and useful. Now it is time to get down to the business of analyzing, tracking and trending your data. While many factors are involved in food production and process control, having an objective measure will help you manage improvements to determine whether something is getting better or worse. Proactive tracking and trending of data can facilitate a root-cause analysis to discover and understand the originating causes of problems, to track the potential source of contamination to avoid delays in product release or to complete investigations, and to identify areas that can benefit from further investigation or process control. Using your data to lead you through activities, such as performing a root-cause analysis, is much more effective than using the apply a band-aid approach to fix issues. Trending of data is important to demonstrate a state of control to identify problems before they get too big (set alert/alarm/threshold limits), to identify process improvements and to determine whether improvements are effective. Trending of microbiological test results, for instance, can make it easier to spot patterns in your data and better manage the risks associated with your process and products. …

Last but not least, there must be proper documentation of the events from the data through the corrective actions, root-cause analysis and verification that the corrective action(s) was effective. Document a timeline, including the date and nature of the deviation, the action plan, the investigation, the results of the investigation, the corrective actions applied, results of any resampling, training records, new SOPs developed or changed, new equipment or construction and conclusions. This is your chance to tell the story and document it for evidence of process control and for future reference. Unfortunately, the precise root cause is not always easy to determine nor is the precise origin of the deviation always that clear-cut. In fact, there may be multiple sources. In addition, and in an effort to get production up and running again, many changes may be made to the process at one time, making it difficult to pinpoint the exact source of the deviation.

Using your data to work for you through tracking and trending guarantees a favorable outcome for everyone involved—particularly the consumer. And, when used, in the case of environmental monitoring and process control of RTE foods, in conjunction with an aggressive and intensive sampling and testing program, it enables the facility to find and eliminate the root cause and verify the sanitary conditions of the production environment, going a long way toward identifying and minimizing the potential for microbial contamination of product through monitoring and management of suppliers and of the RTE process and production environment.


40 years of U.S. Salmonella data now available

Forty years of data on a major cause of food poisoning now is available to the public, the food industry, and researchers in a new report from the Centers for Disease Control and Prevention (CDC). The data, collected by state and federal health officials, provides a wealth of information on Salmonella, the top foodborne cause of hospitalizations and deaths in the United States.

Available for hands-on web access for the first time, the Atlas of Salmonella in the United States, 1968-2011 summarizes surveillance data on 32 types of Salmonella isolates from p0326-salmonella-data-lgpeople, animals, and other sources. The information is organized by demographic, geographic and other categories.

“Salmonella causes a huge amount of illness and suffering each year in the United States. We hope these data allow researchers and others to assess what has happened and think more about how we can reduce Salmonella infections in the future,” said Robert Tauxe, M.D., deputy director of CDC’s Division of Foodborne, Waterborne and Environmental Diseases. “The more we understand Salmonella, the more we can make progress in fighting this threat all along the farm to table chain.”

CDC estimates that Salmonella bacteria cause more than 1.2 million illnesses each year in the United States, resulting in more than 23,000 hospitalizations and 450 deaths. Salmonella infections most often cause vomiting or diarrhea, sometimes severe. In rare cases, Salmonella illness can lead to severe and life-threatening bloodstream infections.

By providing data by age, sex, geography, and season of the year in a downloadable format, the Atlas allows users to view national trends in reported cases of human Salmonella infection over time, problems in specific geographic areas, sources of Salmonella, and the connection between animal and human health. In addition to reports of human infections, it includes reports of Salmonella in animals, the environment, and animal feeds, which can be sources of antibiotic resistant strains.  

Serotyping has been the core of public health monitoring of Salmonella infections for over 50 years. Now, scientists use DNA testing to further divide each serotype into more subtypes and to detect more outbreaks. With the next generation of sequencing technology, advancements continue as the laboratory can find information about the bacteria in just one test.

The data presented likely represent just the tip of the iceberg since many cases of human salmonellosis are not diagnosed and reported to the health department. This underreporting may occur because the ill person does not seek medical care, the health care provider does not obtain a stool culture for testing, or the culture results are not reported to public health officials.

The Salmonella group of bacteria has more than 2,500 different serotypes, but fewer than 100 cause the vast majority of infections in people. Older adults, people with weakened immune systems, and children under five years old have a higher risk for Salmonella infection. Infections in these groups can be more severe, resulting in long-term health consequences or death.

To access the Atlas, please visit http://www.cdc.gov/salmonella/reportspubs/salmonella-atlas/index.html. For more information on Salmonella, please visit: http://www.cdc.gov/salmonella/

Data? You can’t handle data; trust us we’re doing better

In 2012, XL Foods in Alberta sickened at least 18 people with E. coli O157:H7, and led to the largest beef recall in Canadian history; the huge slaughterhouse was subsequently bought by JBS of Brazil.

An independent review panel concluded the outbreak was cause by mediocrity both at the plant and government overseers.

So when the new Canadian president for JBS told an ol’ timey meet-and-greet tour he wouldn’t reveal E. coli incidence rates and you.cant.handle.truththat the Canadian Food Inspection Agency has that figure and JBS is accountable to them, it doesn’t inspire confidence.

Van Solkema said now, six months after the change of ownership, there are four times fewer positive E. coli samples showing up in in-plant tests.

Alberta Liberal health critic Dr. David Swann — who visited the plant under its previous ownership when he was Medical Officer of Health — told the Calgary Herald in general, he was impressed by what he saw Friday.

But Swann also seems to get it, that to build trust and have consumers buy a product, some are going to want to know things, like how often the production line needs to be slowed or halted for one reason or another, how many samples test positive for E. coli contamination, and how much meat is thrown away each month.

“We need to have some kind of objective measures to say this is a safer plant or a safer product than any others,” Swann said. “We need more numbers — injury rate, E. coli rate, throwaway rate, and high-speed line infraction. That would be helpful for everybody, to know that the plant is operating at high levels.”

Having a slaughterhouse president and government inspectors say they are doing a bang-up job, in the absence of any public data, is meaningless.

The JBS plant at Brooks has 2,400 employees and processes 3,800 cattle each day. The plant produces 250 different beef products — the majority of which is shipped to Canadian customers. Beef from Brooks also goes to other markets, including the U.S., Mexico, Egypt, and Asia.


Poop label? Market food safety at retail, not fear

Food labels can be used to shock or shame, illuminate or inform, right-to-know versus hucksterism.

It’s mainly hucksterism. And sometimes fraud.

The U.S. Food and Drug Administration announced today that a federal judge has approved a consent decree of permanent injunction against Butterfly Bakery Inc., a bakery based in Clifton, New Jersey, and its Chicken_labelpresident, Brenda Isaac, for unlawfully distributing misbranded food products, such as muffins and snack cakes.     

Samples tested by both FDA and state officials over several years show that Butterfly Bakery’s product labeling was false and misleading.  For example, laboratory analysis showed that foods labeled as “sugar free” contained sugar, and that certain products contained as much as three times the amount of labeled/declared sugar, two times the amount of labeled/declared fat, and two times the amount of labeled/declared saturated fat.

In the UK, still reeling from food fraud involving horse meat, The Telegraph reports shoppers are seeking more validation about where their food comes from. However, many are bewildered by the variety of claims made by food packaging. The little red tractor that is plastered on many food products, together with claims such as “Freedom Food” and “free range” can be comforting when food supply chain safety is in doubt. But what do these logos really mean, and are you sometimes paying for more than just a misplaced sense of peace of mind? Products bearing these labels and claims often cost more, so it is worth checking whether you think it is worth it before adding to the total cost of your weekly shopping. Here is an explanation of some of the most common labels.

Lion Mark

The Lion Mark on eggs has become common since it was launched in 1998 by the British Egg Industry Council, and the administrators of the mark claim that it means that “eggs have been produced to the highest standards of food safety”. Most significantly, the hens have been vaccinated for salmonella. The eggs produced under the mark are independently audited and have a best-before date stamped on shell and pack.

However, the mark does not guarantee that hens are free range or have high welfare conditions, merely that the eggs are produced to minimum legal requirements. Standard eggs are from hens kept indoors in cages. The Compassion in World Farming report scored the minimum Lion code standards “very poorly” and said they generally ensured compliance only with minimum standards.

Red Tractor

The Red Tractor mark is stamped on a huge variety of farmed goods and claims to be run by “UK farmers, food producers and retailers working together”. Those who use it must pay royalties to the organisation in order to display its jaunty signage. Although people think that the tractor symbol guarantees that your food is British, this is not the case. If you are concerned Food-Labels-Organic-and-Naturalabout the geographical origin of your meat, you must look for a red tractor in conjunction with a Union Flag to guarantee it is from the UK. Other flags indicate that the food is from abroad.

Free range

Most free-range laying chickens are housed in barns and have access to outside land through “popholes”.

There is no legal definition of free-range pork, but it generally means pigs that have access to pasture and are born outside without stalls or crates.

Supermarket own standards

Some supermarkets have higher-than-minimum standards for their own meat. For example, Waitrose and M & S have welfare standards somewhat higher than the bare minimum, so their own-brand products will keep to these standards and may carry a logo to say so.

Labels that mean nothing at all

While all of the above labels have minimum standards attached, there are plenty of claims that supermarket labels use others purely for the feel-good factor, which mean nothing at all. “Natural”, “Country style”, “Farm fresh” and “Garden fresh” are some of these.

In the U.S., vegan advocacy group Physicians Committee for Responsible Medicine wants stronger regulation of feces in chicken and poop labels.

For me, information is good for those who want it and should be layered in recognition that different people want different levels of information. I want to know what a farmer or processor does to reduce or eliminate levels of dangerous microorganisms, the kind that make people barf. Market food safety at retail.


5 years later, Canada releases illness data; trends for Salmonella, Campylobacter, verotoxigenic E. coli and Shigella

The Public Health Agency of Canada, which was created to streamline various public health duties like providing meaningful data on foodborne illness and provide leadership on public health issues (totally useless during the 2008 listeria in deli meats outbreak that killed 22) has gotten around to releasing so-called integrated surveillance data for selected enteric diseases in Canada.

This report focuses on the years 2000 to 2004. The pathogens described are Salmonella, Campylobacter, verotoxigenic Escherichia coli and Shigella. From 2000 to 2004, a general decline in reported rates of all four pathogens was observed in all except a few provinces. When looking at more long-term trends from 1995 to 2004, a similar decline was seen in nationally reported rates for all four pathogens. S. Typhimurium was the most frequently reported Salmonella serovar during the five-year period described, followed by S. Heidelberg and S. Enteritidis. C. jejuni remained the most prevalent Campylobacter species reported between 2000 and 2004. E. coli O157 comprised the majority of verotoxigenic E.coli isolates over these five years. Shigella sonnei was the most frequently reported Shigella species.

Hospitalizations, deaths, outbreaks and case clusters, as well as unusual isolation sites and travel-acquired infections are also explored in this report. Pathogenic E. coli was associated with the highest hospitalization rates over the five-year period, although Salmonella infections resulted in the largest number of deaths overall. Data on outbreaks and case clusters is limited to those reported to the National Enteric Surveillance Program (NESP) and the National Microbiology Laboratory (NML).

Which means, not much. The data is exceedingly limited, and why it took at least 5 years to report is baffling. Canadians can comfortably go back to sleep.