
The Sault (pronounced Sue) is on my mind today.
 Lots of feedback about the Esposito brothers (Tony and Phil) who hail from Sault Ste. Marie (in Ontario, Canada) and, more importantly, most excellent graduate student Katie, who hails from the Sault, got an undergrad at Guelph, did her Masters research in New Zealand and got her degree from Kansas State.
So when JoNel Aleccia of The Seattle Times e-mailed me to get my take on the county’s proposed restaurant inspection disclosure system, I used it as an excuse to get back in touch with Katie.
It’s taken nearly two years, but King County restaurants will soon start posting storefront signs that display their health-inspection status at a glance, giving diners a new view into food safety.
Exactly what those signs will say, however, is still up to the public to decide.
Starting in January, officials with Public Health — Seattle & King County plan to roll out a long-anticipated public grading system that rates restaurants based on an aggregate score of four recent inspections.
Depending on the results, a restaurant may be ranked excellent, good, fair or needs improvement on signs that could feature smiley-face emoji in shades of green and yellow.
“It’s exciting,” said Becky Elias, Public Health food and facilities section manager. “We feel like this is thorough and evidence-based.”
Local diners can vote on six variations of the placards online by Thursday, Nov. 17.
Elias and her crew originally thought a restaurant-grading system could be in place by the start of 2015, but it took longer than anticipated to get it right, she said.
Local health officials overhauled the system that regularly sends 55 inspectors to review more than 11,000 permanent food businesses and an additional 3,000 temporary sites in King County.
With the help of Daniel E. Ho, a Stanford University law professor who has studied restaurant-rating programs extensively, they refined and standardized the way inspectors make decisions and then came up with placards to convey that information to the public.
Throughout the process, they sought out opinions from everyone involved, including restaurant owners and food-safety advocates. Such collaboration was appreciated, said Patrick Yearout, director of recruiting and training for Ivar’s restaurant company, which operates 25 sites in King County.
Food-safety advocates said they’re pleased that King County is unveiling a new ratings system, but they’re not enthusiastic about the smiley-face signs.
Sarah Schacht, 37, of Seattle, is a two-time victim of E. coli food poisoning who has been lobbying the county to help warn consumers about restaurants with unsatisfactory inspections. She’d prefer to see numeric scores on the new signs, not just emoji.
“If you look at these placard examples, in the end, the information you’re supposed to absorb and make a decision on comes down to the size of the smile on the smiley face,” she said. “I think the options are better than nothing, but they’re problematic.”
 Doug Powell, a former Kansas State University food scientist who runs the food-safety site, barfblog.com, said the proposed King County signs “all seem too busy.” If he had to choose, however, he’d choose options B or D, he said.
“At least they are asking people, which is good,” he added.
Katie and I e-mailed, and she said she preferred C, because it was clearly visible from distance, the colour is prominent, the universal symbol avoids language barriers and has better use of space on the card.
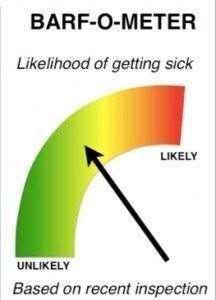
I like B and D because the gauge reminded me of something Katie created years ago while goofing around.
And this is my favorite Tragically Hip song, but no live versions of it.
Filion, K. and Powell, D.A. 2009. The use of restaurant inspection disclosure systems as a means of communicating food safety information. Journal of Foodservice 20: 287-297.
The World Health Organization estimates that up to 30% of individuals in developed countries become ill from food or water each year. Up to 70% of these illnesses are estimated to be linked to food prepared at foodservice establishments. Consumer confidence in the safety of food prepared in restaurants is fragile, varying significantly from year to year, with many consumers attributing foodborne illness to foodservice. One of the key drivers of restaurant choice is consumer perception of the hygiene of a restaurant. Restaurant hygiene information is something consumers desire, and when available, may use to make dining decisions.
Filion, K. and Powell, D.A. 2011. Designing a national restaurant inspection disclosure system for New Zealand. Journal of Food Protection 74(11): 1869-1874 .
The World Health Organization estimates that up to 30% of individuals in developed countries become ill from contaminated food or water each year, and up to 70% of these illnesses are estimated to be linked to food service facilities. The aim of restaurant inspections is to reduce foodborne outbreaks and enhance consumer confidence in food service. Inspection disclosure systems have been developed as tools for consumers and incentives for food service operators. Disclosure systems are common in developed countries but are inconsistently used, possibly because previous research has not determined the best format for disclosing inspection results. This study was conducted to develop a consistent, compelling, and trusted inspection disclosure system for New Zealand. Existing international and national disclosure systems were evaluated. Two cards, a letter grade (A, B, C, or F) and a gauge (speedometer style), were designed to represent a restaurant’s inspection result and were provided to 371 premises in six districts for 3 months. Operators (n = 269) and consumers (n = 991) were interviewed to determine which card design best communicated inspection results. Less than half of the consumers noticed cards before entering the premises; these data indicated that the letter attracted more initial attention (78%) than the gauge (45%). Fifty-eight percent (38) of the operators with the gauge preferred the letter; and 79% (47) of the operators with letter preferred the letter. Eighty-eight percent (133) of the consumers in gauge districts preferred the letter, and 72% (161) of those in letter districts preferring the letter. Based on these data, the letter method was recommended for a national disclosure system for New Zealand.