Paula Wissel of KNKX reports the Washington Department of Health is still investigating this month’s E. coli outbreak that forced a Seattle restaurant to close temporarily. The Matador in Seattle’s Ballard neighborhood has now reopened, but the source of the E. coli that sickened several patrons remains a mystery. Meanwhile, food safety advocates say this latest scare underscores the need for a promised restaurant grading system to be implemented quickly by public health officials.
 Back in 1993, Sarah Schacht, along with her mother and little brother, was sickened in the deadly E. coli outbreak linked to undercooked hamburgers at Jack in the Box. Then, a few years ago, she contracted the foodborne illness again.
“The experience of getting E. coli the second time was much worse. It was feeling like my stomach was being ripped open, I had extreme cramping and I was in and out of the hospital,” Schacht said.
She is one of the primary proponents of restaurants in King County being required to post placards showing what score they received from the health department. She sat on a stakeholders panel convened by the county to come up with a system. Although Public Health of Seattle and King County announced several years ago they were going to implement a system, it has yet to be put in place, which frustrates Schacht.
“They’ve continually rolled back deadlines for this program and so it’s been disappointing to see another outbreak and no posted signs,” Schacht said.
In response, county health officials says they want to make sure that when it launches, the grading system is consistent across eating establishments. The health department has conducted a series of studies to try and figure out how best to obtain that consistency. A grading system pilot program is scheduled to begin in January.
Here’s a couple of suggestions:
Filion, K. and Powell, D.A. 2009. The use of restaurant inspection disclosure systems as a means of communicating food safety information. Journal of Foodservice 20: 287-297.
 The World Health Organization estimates that up to 30% of individuals in developed countries become ill from food or water each year. Up to 70% of these illnesses are estimated to be linked to food prepared at foodservice establishments. Consumer confidence in the safety of food prepared in restaurants is fragile, varying significantly from year to year, with many consumers attributing foodborne illness to foodservice. One of the key drivers of restaurant choice is consumer perception of the hygiene of a restaurant. Restaurant hygiene information is something consumers desire, and when available, may use to make dining decisions.
Filion, K. and Powell, D.A. 2011. Designing a national restaurant inspection disclosure system for New Zealand. Journal of Food Protection 74(11): 1869-1874 .
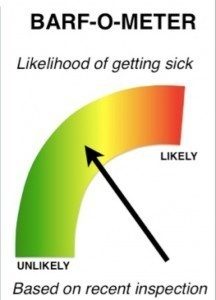
The World Health Organization estimates that up to 30% of individuals in developed countries become ill from contaminated food or water each year, and up to 70% of these illnesses are estimated to be linked to food service facilities. The aim of restaurant inspections is to reduce foodborne outbreaks and enhance consumer confidence in food service. Inspection disclosure systems have been developed as tools for consumers and incentives for food service operators. Disclosure systems are common in developed countries but are inconsistently used, possibly because previous research has not determined the best format for disclosing inspection results. This study was conducted to develop a consistent, compelling, and trusted inspection disclosure system for New Zealand. Existing international and national disclosure systems were evaluated. Two cards, a letter grade (A, B, C, or F) and a gauge (speedometer style), were designed to represent a restaurant’s inspection result and were provided to 371 premises in six districts for 3 months. Operators (n = 269) and consumers (n = 991) were interviewed to determine which card design best communicated inspection results. Less than half of the consumers noticed cards before entering the premises; these data indicated that the letter attracted more initial attention (78%) than the gauge (45%). Fifty-eight percent (38) of the operators with the gauge preferred the letter; and 79% (47) of the operators with letter preferred the letter. Eighty-eight percent (133) of the consumers in gauge districts preferred the letter, and 72% (161) of those in letter districts preferring the letter. Based on these data, the letter method was recommended for a national disclosure system for New Zealand.
