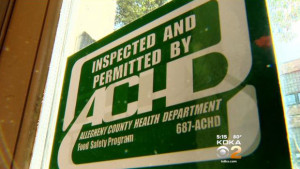
Toronto, New York and Los Angeles have all figured out how to do restaurant inspection grading and make it available on the door.
“I’m pretty happy. It’s a big weight off a lot of people’s shoulders, I’m sure,” said Robert Storms, the owner of Storms Restaurant.
The plan was approved by the Allegheny County Health Department last September.
The Allegheny County Board of Health thought grades would give diners more food safety informationthan the current pass-fail system.
But restaurants fought the plan every step of the way right up to Tuesday night’s vote.
“This discussion is not about increasing the knowledge and training of food service workers, rather it is about catching, punishing and embarrassing,” said Kevin Joyce, of The Carlton.
Some feared a couple of minor infractions could result in a “B” grade, giving diners the wrong impression.
“I firmly believe that if one of my restaurants receives a grade lower than an ‘A,’ that it will not simply affect that particular restaurant, but it will affect our entire brand,” said Mike Mitcham, of Primanti Bros.
 The health board’s motive was to incentivize restaurants to strictly follow the rules.
Ryan Bidney, of Irwin, who was visiting Station Square Tuesday, backs that.
“The restaurant, knowing that that letter grade is gonna be presented, I believe that they’ll feel stronger about, you know, wanting to keep up with their standards and keep their standards higher,” said Bidney.
Pittsburgh, there is research on this stuff.
Filion, K. and Powell, D.A. 2009.
The use of restaurant inspection disclosure systems as a means of communicating food safety information.
Journal of Foodservice 20: 287-297.
Abstract
 The World Health Organization estimates that up to 30% of individuals in developed countries become ill from food or water each year. Up to 70% of these illnesses are estimated to be linked to food prepared at foodservice establishments. Consumer confidence in the safety of food prepared in restaurants is fragile, varying significantly from year to year, with many consumers attributing foodborne illness to foodservice. One of the key drivers of restaurant choice is consumer perception of the hygiene of a restaurant. Restaurant hygiene information is something consumers desire, and when available, may use to make dining decisions.
Filion, K. and Powell, D.A. 2011. Designing a national restaurant inspection disclosure system for New Zealand. Journal of Food Protection 74(11): 1869-1874 .
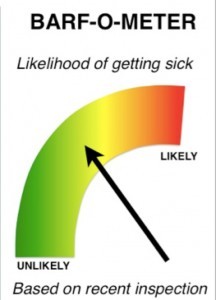
The World Health Organization estimates that up to 30% of individuals in developed countries become ill from contaminated food or water each year, and up to 70% of these illnesses are estimated to be linked to food service facilities. The aim of restaurant inspections is to reduce foodborne outbreaks and enhance consumer confidence in food service. Inspection disclosure systems have been developed as tools for consumers and incentives for food service operators. Disclosure systems are common in developed countries but are inconsistently used, possibly because previous research has not determined the best format for disclosing inspection results. This study was conducted to develop a consistent, compelling, and trusted inspection disclosure system for New Zealand. Existing international and national disclosure systems were evaluated. Two cards, a letter grade (A, B, C, or F) and a gauge (speedometer style), were designed to represent a restaurant’s inspection result and were provided to 371 premises in six districts for 3 months. Operators (n = 269) and consumers (n = 991) were interviewed to determine which card design best communicated inspection results. Less than half of the consumers noticed cards before entering the premises; these data indicated that the letter attracted more initial attention (78%) than the gauge (45%). Fifty-eight percent (38) of the operators with the gauge preferred the letter; and 79% (47) of the operators with letter preferred the letter. Eighty-eight percent (133) of the consumers in gauge districts preferred the letter, and 72% (161) of those in letter districts preferring the letter. Based on these data, the letter method was recommended for a national disclosure system for New Zealand.

