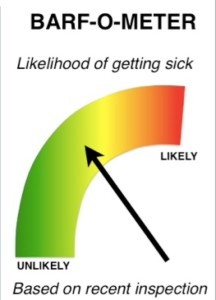
Would you rather eat at a restaurant with food safety practices that are “fair” or “standard”? What makes a kitchen that’s “superior” better than a competitor that’s merely “excellent”?
 Those are the four categories the Douglas County Health Department uses to rate restaurant food safety, and the ratings are the only information available online to the public about how restaurants perform in inspections.
Some members of the department’s Board of Health would like to replace that system with one that rates establishments with a letter grade — an A, B or C.
“It’s easily understood,” said Lawrence Albert, a food manufacturing industry consultant who is the health board’s vice president. He has raised the issue at board meetings but said it has not advanced past discussion.
The top county health official, however, doesn’t believe a change is needed to the current rating system.
“We know that our community feels pretty comfortable, and knows what it means” when they see “fair” or “standard,” said Dr. Adi Pour, county health director.
Some in the restaurant industry disagree.
“The public doesn’t understand how the grading
system works, and the media doesn’t understand how the grading system works, and that’s a problem,” said Jennie Warren, executive director of the Omaha Restaurant Association.
Warren said she’s glad the health department is evaluating its system and said the association will work with the department.
 This might help guide your work:
Filion, K. and Powell, D.A. 2009.
The use of restaurant inspection disclosure systems as a means of communicating food safety information.
Journal of Foodservice 20: 287-297.
The World Health Organization estimates that up to 30% of individuals in developed countries become ill from food or water each year. Up to 70% of these illnesses are estimated to be linked to food prepared at foodservice establishments. Consumer confidence in the safety of food prepared in restaurants is fragile, varying significantly from year to year, with many consumers attributing foodborne illness to foodservice. One of the key drivers of restaurant choice is consumer perception of the hygiene of a restaurant. Restaurant hygiene information is something consumers desire, and when available, may use to make dining decisions.
Filion, K. and Powell, D.A. 2011. Designing a national restaurant inspection disclosure system for New Zealand. Journal of Food Protection 74(11): 1869-1874 .
The World Health Organization estimates that up to 30% of individuals in developed countries become ill from contaminated food or water each year, and up to 70% of these illnesses are estimated to be linked to food service facilities. The aim of restaurant inspections is to reduce foodborne outbreaks and enhance consumer confidence in food service. Inspection disclosure systems have been developed as  tools for consumers and incentives for food service operators. Disclosure systems are common in developed countries but are inconsistently used, possibly because previous research has not determined the best format for disclosing inspection results. This study was conducted to develop a consistent, compelling, and trusted inspection disclosure system for New Zealand. Existing international and national disclosure systems were evaluated. Two cards, a letter grade (A, B, C, or F) and a gauge (speedometer style), were designed to represent a restaurant’s inspection result and were provided to 371 premises in six districts for 3 months. Operators (n = 269) and consumers (n = 991) were interviewed to determine which card design best communicated inspection results. Less than half of the consumers noticed cards before entering the premises; these data indicated that the letter attracted more initial attention (78%) than the gauge (45%). Fifty-eight percent (38) of the operators with the gauge preferred the letter; and 79% (47) of the operators with letter preferred the letter. Eighty-eight percent (133) of the consumers in gauge districts preferred the letter, and 72% (161) of those in letter districts preferring the letter. Based on these data, the letter method was recommended for a national disclosure system for New Zealand.
