Seattle, self-proclaimed home of all things food safety, is finally going to get a restaurant inspection disclosure program, about 15 years after Toronto (there’s older programs, but that the one I was involved with).
 King County announced this week that it will begin posting food and health safety ratings for all to see. The new rating system will affect approximately 12,000 restaurants and food trucks in the area, starting in late 2015, according to the Seattle Times.
Schacht’s campaign for more transparency was also spurred by how difficult it was to find an establishment’s rating through King County’s existing health department site. Her petition called it a “convoluted inspection ratings system that confuses consumers.” More than 2,000 people agreed and signed her petition for clearer signs to be posted at restaurant locations.
Rating restaurants is already status quo in other major cities, like New York and Los Angeles. Now Seattle will join the ranks of this handy system, which lets customers get a good look at how clean a joint is before they enter.
The use of restaurant inspection disclosure systems as a means of communicating food safety information
Introduction
The World Health Organization (WHO) estimates that up to 30 per cent of individuals in developed countries become ill from food or water each year (World Health Organization 2007). Up to 70 per cent of these illnesses are estimated to be linked to food prepared at foodservice establishments (Lee & Middleton 2003; Olsen et al. 2000; Todd 1998; Center for Science in the Public Interest 2008). Media coverage of food safety issues is extensive and may fuel the view that hygiene standards are low among restaurants (Bruhn 1997; Worsfold & Worsfold 2008). Consumer confidence in the safety of food prepared in restaurants is fragile, varying significantly from year-to-year (Food Marketing Institute 2008), with many consumers attributing foodborne illness to foodservice (Fein et al. 1995). One of the key drivers of restaurant choice is consumer perception of the hygiene of a restaurant (Worsfold & Worsfold 2007). Restaurant hygiene information is something consumers desire, and when available, may use to make dining decisions (Worsfold & Worsfold 2007).
Restaurant food safety standards are assessed through routine examinations. These examinations, also called health, hygiene, foodservice or restaurant inspections, are principally designed to prevent restaurant-associated foodborne disease outbreaks (Jones et al. 2004; Reske et al. 2007). In addition, restaurant inspections may significantly impact consumer confidence in the safety of restaurant food, influence dining decisions, and provide incentives for establishments to promote a safe food environment (Fielding et al. 2001; Jin & Leslie 2003; Simon et al. 2005; Worsfold & Worsfold 2007) when publically available.
About the inspection process
The fundamentals of restaurant inspection are well established throughout developed countries. Municipal restaurant inspections are food safety risk management programs, an action, to demonstrate to consumers that food providers are cognizant of consumer concerns about food safety, and demonstrate that those within the farm-to-fork system are working to reduce levels of risk (Powell 2002).Methods of scoring inspection results vary between jurisdictions. The criteria for inspection is fairly well established, however inconsistencies between municipalities exist when defining a critical violation. Though often described as a violation more likely than others to contribute to food contamination, illness, or health hazards, the actual items that constitute a critical violation during the inspection process may vary. In some jurisdictions the presence of a critical violation elicits closure followed by re-inspection, and in others it simply results in a lower inspection score. As a result, many systems exist to quantify results during inspection. Starting with a value of 100 and subtracting violations (with critical violations being a larger deduction) is one method. In this method, a score of 100 is awarded to establishments that comply with food hygiene standards. Conversely, beginning with zero and tallying violations (with critical violations being worth a higher value), a larger numerical value indicates a riskier food establishment. Other jurisdictions simply tally violations, and may or may not indicate whether these are critical or non-critical. Variations not only exist between jurisdictions or municipalities, but between inspectors; though inspector training is designed to synchronize violation interpretations, it will vary from person to person. The many variables of the inspection process will affect inspection disclosure schemes, but are outside the scope of this paper.
 Inspection disclosure
Systems to communicate the information acquired through restaurant inspection to the public are common in developed countries; however, these systems are inconsistent, varying between countries, states or cities. In some jurisdictions, a consumer must formally request to view the most recent inspection, and may wait months before receiving the results (Center for Science in the Public Interest 2008). In other jurisdictions, it is available upon request at the restaurant. These methods are neither convenient nor reasonable for most consumers, as inspection reports are often difficult to understand (Center for Science in the Public Interest 2008). Disclosure systems in which inspection information must be requested by the consumer provide minimal incentive for foodservice establishments to produce safe food. Seiver & Hatfield (2000) suggest that the public disclosure of restaurant inspection results communicates the importance of risks and violations found during an inspection. With several of the key elements of a foodservice operation being hidden from consumers (such as food storage conditions, or where food is purchased) consumers will look to observable information cues during establishment selection (Henson et al. 2006). Restaurant inspection disclosure systems can provide such information cues.
Grading systems enforced by public health agencies have spread worldwide since being established in 1924, at which time letter grades were introduced to classify milk in the United States (Boehnke 2000). Disclosure systems are growing in popularity, largely due to consumer demand for such tools.After seven years of discussion, the U.K. Food Standards Agency began a pilot program, “Scores on Doors”, with local authorities to establish a U.K.-wide system to provide restaurant inspection results to the public. The U.K. pilot programs used a variety of codes, including star ratings, smiley faces, letter grades and the phrases “pass” or “improvements required” (Worsfold & Worsfold 2007). The first of the U.K. “Scores on Doors” program was introduced in 2004, and only 3 years later over 30 different schemes were operating throughout U.K. municipalities (Worsfold & Worsfold 2007). Similar inspection disclosure systems involving these codes, and others, are in place in several cities, states and provinces around the world. The codes attempt to simplify inspection results into a format that is understandable and intriguing to consumers dining at an establishment.
Inspection disclosure systems can be organized into three categories: those that provide information through municipal or state health departments, those that provide information online, and those that provide information at the establishment. Inspection reports disclosed through health departments often must be accessed through a Freedom of Information Act (Worsfold 2006a). Online databases vary in content, and may be used to compliment disclosure at the premise. Maintenance of online restaurant inspection databases may be by local health departments, news stations, or increasingly, consumer blogs. Disclosure systems displaying information at the establishment do so in the format of a card, with most inspection authorities requiring the cards to be posted in designated, conspicuous locations visible to patrons entering the restaurant (North Carolina Administrative Code 2005).
The following are examples of restaurant inspection disclosure systems:
Online database of results. Many disclosure systems at the establishment are complimented by an online database of inspection results, with the format and content of these websites varying between municipalities. Since the first posting of inspection results online in Los Angeles (L.A.) County in 1998 (Fielding et al. 2001), many inspection authorities have adopted this medium to present a database of results searchable by establishment name or code, neighborhood, location, or results from the latest inspection (New York City 2008; DPR Online Services 2008; Office of Environmental Health Services 2008). Some of these databases provide only the number of critical violations, or of both critical and non-critical violations, while others elaborate with details of the cited infractions. Some jurisdictions, such as the U.S. state of Alaska, provide online copies of all food establishment inspection reports completed by inspectors (Division of Environmental Health 2008). Other inspection authorities allow consumers to receive e-mail updates when new inspection results are posted (Central District Health Department 2007).
Presently in the U.K., food establishments may voluntarily post inspection scores or symbols at their premises, but are not required. However, all inspection reports are available through local inspection authority websites (Worsfold & Worsfold 2008). Websites appear to be a popular method of restaurant disclosure, with many municipalities adopting this medium. Several areas in Scotland began posting inspection results in November 2006 after a survey found 82 per cent of consumers wanted to see inspection information at local eating establishments, and 94 per cent thought it should be accessible online (Worsfold & Worsfold 2007). Consumers and businesses reported that the posted results were valuable, according to research by the Food Standards Agency of Scotland several months later (Worsfold & Worsfold 2007). However, a review of the DineSafe disclosure scheme in Toronto, Canada revealed only 10 per cent of the public was aware of the online component, compared to 75 per cent being aware of inspection notices posted at the premise (Toronto Staff Report 2002). Additionally, though initially popular, online disclosure websites may receive decreased visits after the initial novelty of the system wears off, as the city of Waterloo, Canada experienced (Barrick 2009).
Online name-and-shame. Rather than a database of results, online name-and-shame notices are published by the Food Safety Authority of Ireland, where foodservice establishments that fail to improve conditions of practices deemed “likely to pose a risk to public health” are issued an Improvement Order that is posted on the Authority’s website until the situations are corrected. Following correction, the Improvement Order remains visible to the public for another three months. A Closure Order is issued if “there is likely to be a grave and immediate danger to public health” or an Improvement Order is not complied in a timely fashion. These orders are likewise posted to the website until situations are remedied, and for three months afterwards (Food Safety Authority of Ireland 2008).
 grades. The California county of San Diego was one of the first regions in the U.S. to create a disclosure system to convey inspection results to the public, introducing letter grades to rate establishments in 1947 (Foley 2009) L.A. County followed suit, and since 1996, has required food establishments to display the results of their most recent restaurant inspection in the form of an A, B, or C letter grade; except in the case of restaurants scoring below a ‘C’, for which the actual numerical value is provided (Teledas Co. 2004). Multiple major U.S. cities have adopted similar systems, as have several states. In Auckland, New Zealand, a food hygiene grade from A to E is assigned to inspected establishments, with the exception of ‘C’, as it may be mistakenly thought of as a ‘passing’ grade, and the addition of a Gold A, which recognizes establishments that demonstrate safe practices above full compliance with food hygiene laws. The hygiene grade must be displayed “in a prominent position on the premises that is visible to the public” (Auckland City Council 2007). Other examples of letter grade systems include: AA, A or B grades; A or B grades; and A, B, C or D grades (Pytka & Fellow 2005).
Numerical scores. A common checklist for restaurant inspection used in the U.S. is the FDA-approved Foodservice Establishment Inspection Report. This is a 44-point list of violations assigned a weight based on their risk to human health. The highest possible score is 100, which is reduced when violations are cited. Though the inspection checklist may be consistent, what constitutes establishment closure is not. In Danbury, Connecticut, an establishment must score 80 and not receive any 4-point violations to receive a pass; in Nashville, Tennessee, a score of 70 is required to pass inspection. In Mobile, Alabama, a score below 85 elicits closure and re-inspection (Mobile County Health Department 2008). The numerical score and copy of the inspection report are required to be posted at the establishment. Inspection authorities that do not deduct violations from 100, but rather a more unattractive number, will often later convert this value to one out of 100 for the sake of simplicity. Converse to deducing points for violations, in New York City, health officials assign a numerical score during inspections that tallies violations. Scores greater than 28 denote the restaurant as a public health hazard, and must be re-inspected to ensure corrections are made (New York City 2008). New York City has recently proposed a plan to disclose inspection results to the public using a letter grade system similar to that of L.A., rather than posting a numerical score card at the premises (Collins 2009).
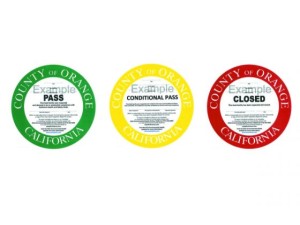
Colored cards. Officialsin the city of Toronto, Canada, require food establishments to display their most recent inspection results in the main entrance of premises in the form of a green, yellow or red card, indicating a pass, conditional pass, or closed notice, respectively (City of Toronto 2008). During the development of the Toronto disclosure system, a review of current literature indicated that color could be used to draw attention and suggest caution (Powell 2002). A similar system used in Columbus, Ohio, includes the green, yellow and red color cards, with the addition of a white notice that is issued when an establishment is on probation and requires a follow-up inspection. The red card in this case is used when an establishment on probation failed re-inspection (Columbus Public Health 2006). Using a combination of numerical and color disclosure schemes, Lexington-Fayette county in Kentucky discloses scores of 85 or above, and no four- or five-point violations, receive the score posted in green; 84 and under, or those with four- or five- point violations will be posted in red; and those below 70 will be issued “Notice of intent to Suspend Permit” (Lexington-Fayette County 2008).
Statement cards. The Niagara Region of Ontario, Canada conducts inspections similar to those in the city of Toronto, however its disclosure system describes inspected establishments as simply “in compliance” or “not in compliance.” This region also maintains an online database to convey the most recent inspection results to consumers, with details of critical and non-critical violations (Regional Municipality of Niagara 2008). A study in Hamilton, Ontario (Hensen et al. 2006)—a municipality which initially used only “pass” and “fail” notices, but was considering utilizing the “conditional pass” notice—found that the additional “conditional pass” option had a “significant and negative impact” on survey respondent’s self-reported likelihood to patronize a restaurant. Other examples of information statements include: “approved” or “not approved”; “satisfactory” “conditionally satisfactory” or “unsatisfactory”; “exceeds minimum standards” “meets minimum standards” or “does not meet minimum standards” (Pytka & Fellows 2005).
Symbols. Since 2001, the Danish Veterinary and Food Administration has used smiley faces as a means to disclose restaurant inspection results to the public. The full details of Danish inspection reports are published on a website (www.findsmiley.dk), with a “smiley” face depicting five different scenarios, which range from a sad, “sour smiley”—assigned to establishments that were issued a fine, reported to the police, or had approval withdrawn—to an ecstatic “happy smiley” for restaurants that received no negative remarks. The newly added Elite-Smiley may also be awarded when establishments receive the happy smiley in four consecutive inspections. These reports and respective smiles must be posted at the restaurant premises, and visible to consumers outside the establishment who are making a choice to dine there (Danish Veterinary and Food Administration 2008). Inspection results in the northern region of the U.S. state of Iowa are conveyed using the 5-Star Program in which colored stars assigned to establishments correspond with positive food handling behaviors observed during inspection. A yellow star is awarded when proper holding temperatures are respected; a blue for proper cooking; red for clean equipment; brown for good employee hygiene; and a green star when the establishment’s food ingredients are received from safe sources. For each inspection the restaurant’s awarded stars are displayed online alongside the number of critical and total violations cited (Cerro Gordo County 2008). In the U.S. state of Connecticut, Farmington Valley and Norwalk counties, respectively, use waiter or lighthouse symbols to disclose inspection information: a score of 90-100 receives 3 waiters or lighthouses, 80-89 receives 2, and below 80 receives 1 (Farmington Valley Health Department 2009; Norwalk Health Department 2009).
Award schemes. In addition to inspection disclosure systems, several municipalities have elected to provide awards for establishments that exceed food safety standards. The aforementioned Gold A granted in Auckland, New Zealand, or the Elite Smiley in Denmark, are examples of these award schemes, and often are in addition to existing disclosure systems at the establishment. During evaluation of the Eat Safe award scheme in the U.K., Worsfold (2005) found 79 per cent of those surveyed said they would be influenced by the presence of a hygiene award. However, it is noted in previous evaluations that there is little public awareness of a similar award scheme in Scotland (Worsfold 2005).
There is no agreed upon best method to communicate inspection results with the public, with many vehicles being used throughout the world (Powell 2002). Although many restaurant inspection disclosure systems exist, further research could determine which of these existing schemes are most effective.
Benefits of disclosure systems
Consumers both desire and deserve accessible and understandable information on the conditions and practices of foodservice establishments. Consumer interest in the website that discloses inspection results for the U.K. city of Liverpool generated 100,000 hits within two days of posting the first inspection results (Chartered Institute of Environmental Health 2007). Information provided on such mediums can be a comfort to diners, demonstrating that restaurants are being monitored for food hygiene standards. According to the director of public health for L.A. County, Dr. Jonathan Fielding, the grading system used in L.A. bolsters consumer confidence in the county’s restaurant inspection system (Center for Science in the Public Interest 2008). Consumers in the city of Hamilton, Canada were asked how important the presence of an inspection notice in a restaurant’s window was when choosing where to dine, and respondents assigned it an average importance of 4.44 on a 5-point scale (Henson et al. 2006). As many as 95 per cent of residents surveyed in Toronto, Canada, indicated they made dining decisions based on the colored inspection cards posted at establishments (Toronto Staff Report 2002).
By influencing restaurant choice, inspection result postings can provide incentives for those within the foodservice industry to focus on food safety endeavors. Restaurateurs and patrons react emotionally to posted scores (Wiant 1999). Public reporting of poor inspection results may lead to negative consumer attitudes towards an establishment, and consequently influence foodservice workers and managers to comply with regulations in order to improve food safety scores (Almanza et al. 2002). According to the Ministry of Food Agriculture and Fisheries in Denmark, over half (59 per cent) of consumers have changed their dinner plans after reviewing the smiley face posted at a restaurant. The Ministry asserts that the smiley scheme is one of the best-known consumer public schemes in Denmark, and a recent survey found that 97 per cent of consumers felt the scheme was a “good” or “very good” idea, as did 88 per cent of foodservice businesses. Additionally, 8-out-of-10 managers or owners reportedly discussed practices with their staff that would lead them to attain the coveted “happy smiley” (Danish Veterinary and Food Administration 2008).
Hospitalization rates linked to suspect foodborne illnesses were seen to decrease by approximately 20 per cent in the year a mandatory letter grade disclosure system was implemented in L.A. County (Simon et al. 2005; Jin & Leslie 2003). However, limitations in surveillance data make it impossible to determine in which settings the majority of foodborne illnesses occur (Powell 2002), let alone the relationship between inspection disclosure systems and a reduction in illness rates. Restaurant grade cards in L.A. did promote food safety awareness in the public, and provided incentive for restaurants in the county to comply with food safety regulations and increase inspection scores (Fielding et al. 2001; Jin & Leslie 2003). A similar system in Las Vegas, Nevada also found that establishments were more likely to increase diligence in food safety practices to maintain compliance (Hahn 2000). A review of the color-coded disclosure system in Toronto, Canada, concluded it successfully “increased compliance and continuous improvement in food safety” among Toronto restaurants (Basrur 2003). Food safety violations were also reported to decrease for the city’s restaurants (Toronto Staff Report 2002).
Tools that compliment inspection disclosure schemes, such as hygiene information on a respected website, can and will be used by a proportion of consumers, though it should not be used to substitute disclosure at the premises (Spear 2006). The Toronto, Canada study indicated that consumers were more aware of disclosure at the premise, in the form of colored cards, than the website (Toronto Staff Report 2002). According to Worsfold & Worsfold (2008), online disclosure systems provide the computer-literate consumer quick and relatively easy access to inspection information.
Issues with inspection disclosure
The process of restaurant inspection itself is fraught with issues (Chapman et al. 2008):
- frequency of inspection varies between jurisdictions;
- inspections may be scheduled or unannounced depending on the jurisdiction; and,
- time of day an inspection occurs may affect an establishment’s performance, as busier times result in increased food hygiene infractions .
Criteria for inspection is inconsistent — most notably the definition of ‘critical violation’ varies between jurisdictions. During the inspection process there are several food safety issues that are difficult to assess in the brief timeframe of an inspection, such as acquiring food from a safe source. Perhaps one of the most significant issues with the inspection process is the variation between inspectors due to subjective interpretation: what one inspector may view as a violation may not be a violation to another inspector (DeNucci 2007). Though standardized training is often required for health inspectors, subjective interpretation is a continuous issue.
The purpose of restaurant inspection is ultimately to reduce the incidence of foodborne illness, yet research has indicated that inspection scores are not predictive of foodborne illness outbreaks. In a review of 167,574 inspections in the U.S. state of Tennessee between January 1993 and April 2000, Jones et al. (2004) found that mean inspection scores of establishments experiencing foodborne illness outbreaks did not differ from establishments without reported illnesses. Cruz et al. (2001) reviewed inspection scores for 51 food establishments associated with confirmed foodborne illness outbreaks in Miami-Dade County, Florida, in 1995 and compared these reports to randomly selected establishments without outbreaks. The study suggested that inspections in Miami-Date County did not reliably identify restaurants with increased risk of foodborne illness (Cruz et al. 2001). Though other studies have focused on the relationship between restaurant inspection scores and foodborne illness, methodological problems decrease the veracity of these studies.
While inspection scores are not predictive of foodborne illness outbreaks, creating a study that accurately measures the relationship between restaurant inspection scores and foodborne illness outbreaks is difficult. As Jones et al. (2004) suggest that “reported foodborne outbreaks are rare in relation to the number of restaurants and the small percentage of suspected foodborne illnesses linked to epidemiologically confirmed, restaurant-associated outbreaks make such analyses difficult.” With numerous variables and inconsistencies in the restaurant inspection process itself, health inspectors and those within the foodservice industry debate whether consumers are able to understand the meaning of posted inspection information (Almanza et al. 2002). Multiple studies suggest consumers may have little understanding of the meaning of posted letter grades or inspection scores, though their interpretations play a role in their choice to patronize a restaurant (Dundes & Rajapaksa 2001; Hensen et al. 2006).
Accurately quantifying all of the aspects of inspection to create a risk communication tool that can convey a message about the safety of a food establishment is a daunting task. Jones & Grimm (2008) found that, in a region where restaurants were required to make inspection results publicly visible on their premises and allow information to be disclosed on the Internet, survey participants indicated the availability of this information had an effect on where they chose to eat. However, the researchers also found that consumers have a number of misconceptions and unrealistic expectations of the restaurant inspection system (Jones & Grimm 2008). Worsfold (2006b) suggested that restaurant patrons are not well informed about the role of local authorities in protecting food safety and how the food safety laws are enforced. For example, consumers may be confused as to how often inspections take place and, therefore, how frequently violations occur at an establishment (Hensen et al. 2006). Restaurant inspections report on the conditions of an establishment at a single point in time, and may not reflect the overall (good or bad) culture of food safety at the restaurant (Chapman 2008). Though an inspection is only designed to evaluate an establishment at one moment in time, patrons interpret scores as an overall indicator of quality (Wiant 1999).
Details of inspection reports may also be difficult to understand. Consumers may have difficulty assessing the severity of violations cited in terms of their risk to food safety (Worsfold 2006b). Additionally, inspection and disclosure systems can vary between jurisdictions, which may lead to confusion among consumers who dine in multiple jurisdictions. An examination by the San Diego Union-Tribune of inspection data in San Diego County, California, found that restaurants receiving an A grade—the top rating for that jurisdiction—may have also been cited for up to two major violations, which are those thought to “pose an imminent health hazard.” The newspaper noted that most jurisdictions throughout the U.S. are reluctant to award establishments a top grade with even one major violation in their report (Williams & Armendariz 2007). These variations in what constitutes a score between jurisdictions can be confusing for consumers, but even with a unified system problems will arise. Hatfield & Siever (2001) found with numerical grading schemes, consumers still think in terms of pass/fail. This may be true in the case of letter grades, colored cards, or any other disclosure methods.
Pressure from the restaurant industry may hinder implementation (Wiant 1999). Worsfold (2006a) found some objection among hospitality and food service management to the ‘Scores on Doors’ program in the U.K. Some managers were averse to implementing public disclosure systems for fear of confusing consumers, as mentioned above, or the difficulty and cost of implementing such a program (Worsfold 2006a). Additionally, concerns have been raised in simplifying the complexities of the restaurant inspection report into a single score, grade, or symbol (Worsfold 2006a).
Research needs
Previous research has focused on assessing the effectiveness of implemented inspection disclosure systems, but has not determined which system or medium is most desired by consumers. Research should focus on determining which medium consumers and those within the food industry prefer inspection information to be disclosed through, and whether complimentary tools are something consumers and restaurant operators want.
Do consumers prefer disclosure at the premise in the form of cards, and if so, which format — letter grades, numerical scores, symbols, colored cards, or phrases — is preferable? Various scores and grades have been used to communicate restaurant inspection results to the public, but which of these is most effective is not known. Even within a particular score category, such as letter grades, there are unknowns. For example, how effective is a 3-tier scheme of A, B, and C compared to a similar 4-tier letter scheme? Are consumers misled with those middle terms, like ‘C’, as some jurisdictions predict? Are multi-tier schemes the best way to communicate inspection results to the public, or do consumers solely think in terms of pass/fail as some research has shown (Hatfield & Siever 2001)?
Additionally, it is unknown to what degree inspection information should be disclosed to consumers. Examples of score schemes vary from a simple notification of “pass”, “conditional pass”, or “fail” (City of Toronto 2008), to detailed pictograms color coordinated to expose various elements of the inspection process (Cerro Gordo County 2008).
It is unknown whether a combination of mediums is most effective – e.g. score cards displayed on premises with basic information, and further details of infractions available online – or, whether one medium alone is most desired by consumers. Research should focus on determining the most compelling method for communicating results to the public. Once this method is determined, creating a consistent system within states or countries can be assessed.
Food safety is not the only factor affecting consumer patronage to dining establishments. Many studies have researched these factors, indicating that friends/relatives/colleagues, media (newspapers and TV programs), image, atmosphere, food quality and cost, and overall cleanliness are factors affecting one’s decision to dine in a particular establishment (Worsfold 2006a; Gregory & Kim 2004; Leach 2003; Cheang 2002). Although some research has indicated consumers rate food safety as more important than any other factor (Worsfold, 2006b), and it is self-reported that consumers would not dine at an establishment with a poor inspection rating (Worsfold 2006b; Leach 2003), whether this would, in reality, affect a diner’s decision is unknown. The ‘loyalty’ factor—consumers who dine at an establishment in support of a cause/friend/relative/colleague—also may affect one’s decision to dine at an establishment, regardless of the above-mentioned qualities. Research could determine whether pairing restaurant food safety scores with that of quality, cuisine and atmosphere is attractive to consumers. Finally, what approach is best to acquire information about consumer preference of disclosure systems?
Conclusions
Restaurant inspections are flawed and may appear complicated, but foodservice safety information is something consumers desire. Public disclosure of inspection information helps foster a culture of food safety by encouraging dialogue about food safety issues among both consumers and those within the foodservice industry. Research cannot assume that because inspection is complicated it is beyond the scope of a public disclosure scheme. Research should focus on providing compelling information through the most consumer-desired medium or combination of mediums, while encouraging those within the foodservice industry to promote a safe food-handling environment. Once these tasks have been accomplished, disclosure system consistency within a state or country should be developed. Perhaps ultimately public inspection disclosure systems will be embraced by those within the foodservice industry and be a way for restaurants to market food safety.
Acknowledgements
The authors would like to acknowledge the assistance of Casey J. Jacob in the preparation of this manuscript.
References
Almanza AB, Ismail J, Mills J (2002). The impact of publishing foodservice inspection scores. Journal of Foodservice Business Research 5:45-62.
Aukland City Council (2007). Food grading search. Available at http://www.aucklandcity.govt.nz/council/services/foodsearch/grading.asp (accessed 15 July 2008).
Barrick R (2009). Food safety watchdog looks to restore website popularity. The Record, 10 February 2009. Available at: http://news.therecord.com/News/Local/article/485193 (accessed 25 February 2009).
Basrur S (2003). Evaluation of the food premises inspection and disclosure system. Toronto Public Health, City of Toronto. Available at: http://app.toronto.ca/food2/pdf/food_safety_evaluation.pdf (accessed 5 June 2008).
Bruhn, CM (1997). Consumer concerns: motivating to action. Emerging Infectious Diseases 3(4):511-515.
Boehnke RH (2000). International survey on public posting of restaurant inspection reports, and/or grade card posting schemes based upon health inspections. Region of Ottawa-Carleton Health Department, Ottawa.
Chapman B. (2008) Put food safety on the menu. New Zealand Food Safety Authority, Food Focus – February 2008. Available at: http://www.nzfsa.govt.nz/publications/food-focus/2008-02/page-18.htm (accessed 2 June 2008).
Chapman B, Eversley T, Filion K, MacLaurin T, Powell D (2008). An observational study of food safety practices at food service conducted through video capture. IAFP Technical Abstracts. p. 45.
Chartered Institute of Environmental Health (2007). FSA ‘should iron out bugs.’ Environmental Health News. 4 May.
Center for Science in the Public Interest (2008). Dirty dining: restaurants need food safety letter grades, says CSPI. 7 August.
Central District Health Department (2007). Inspections. Idaho Health District 4. Available at: http://www.cdhd.idaho.gov/EH/food/inspect.htm (accessed 18 July 2008).
Cerro Gordo County (2008). 5 star program on the web. Department of Public Health. Available at: http://data.netconx.net/cghealth/default.cfm (accessed 21 August 2008).
Cheang M (2002). Older adults’ frequent visits to a fast-food restaurant: non-obligatory social interaction and the significance of play in a “third place”. Journal of Aging Studies 16:303-321.
City of Toronto (2008). Dinesafe: Toronto Food Premises Inspection and Disclosure System. Toronto Public Health. Available at: http://app.city.toronto.on.ca (accessed 21 June 2008).
Collins G (2009). Diners get a quick guide to cleanliness. The New York Times, 30 January 2009. Available at: http://www.nytimes.com/2009/01/31/nyregion/31health.html?_r=1&ref=nyregion (accessed 24 February 2009).
Columbus Public Health (2006). Columbus Public Health SIGNS. City of Columbus. Available at: http://www.publichealth.columbus.gov/media/Feature_Section_Page_2.asp (accessed 21 July 2008).
Cruz MA, Delores K, Swarez JA (2001). An assessment of the ability of routine restaurant inspections to predict food-borne outbreaks in Miami-Dade County, Florida. American Journal of Public Health 9:821-823.
Danish Veterinary and Food Administration (2008). Smileys keep food safety high in Denmark. Ministry of Food, Agriculture and Fisheries Denmark. Available at: http://www.uk.foedevarestyrelsen.dk/Inspection/Smiley/forside.htm (accessed 18 July 2008).
DeNucci J (2007). Independent State auditor’s report on certain activities of the department of public health food protection program: July 1, 2003 through December 31, 2005. Report No. 2005-0290-3S.
Division of Environmental Health (2008). Food safety & sanitation program. State of Alaska. Available at: http://alaska.state.gegov.com/alaska/ (accessed 21 August 2008).
DPR Online Services (2008). Licensee search. Florida Department of Business and Professional Regulation. Available at: https://www.myfloridalicense.com/wl11.asp?mode=0&SID=&brd=H (accessed 18 July 2008).
Dundes L & Rajapaksa S (2001). Scores and grades: A sampling of how college students and food safety professionals interpret restaurant inspection results. Journal of Environmental Health 64:14.
Farmington Valley Health Department (2009). Ratings and inspections for local food service establishments. Available at: http://www.fvhd.org/fr_a_main.asp (accessed 14 April 2009).
Fein S, Lin CT, Levy A (1995). Foodborne illness: perceptions, experience and preventative. Journal of Food Protection 58:1405-1411.
Fielding JA, Aguirre A, Palaiologos E (2001). Effectiveness of altered incentives in a food safety inspection program. Preventative Medicine 32:230-244.
Foley T (deh.fhdutyeh@sdcounty.ca.gov) (2 June 2009). Implementation of restaurant grading system in San Diego County. E-mail to: Filion K (misskatiefilion@gmail.com).
Food Marketing Institute (2008). FMI Grocery shopper trends 2008: economic concerns shaping how consumers shop, cook and dine. FMI News Release. Available at: http://www.fmi.org/news_releases/index.cfm?fuseaction=mediatext&id=935 (accessed 14 April 2009).
Food Safety Authority of Ireland (2008). Enforcement. Available at: http://www.fsai.ie/enforcement/index.asp (accessed 21 July 2008).
Gregory S & Kim J (2004). Restaurant choice: the role of information. Journal of Foodservice Business Research 7:81-95.
Hahn MI (2000). Should inspection scores be published? [Letter to the Editor] Journal of Environmental Health 62:31.
Hatfield TH & Siever OH (2001). Preference reversals in grading systems for retail food facilities. Journal of Environmental Health 63:19-25.
Hensen S, Majowicz S, Masakure O, Sockett P, Jones A, Hart R, Carr D, Knowles L (2006). Consumer assessment of the safety of restaurants: The role of inspection notices and other information cues. Journal of Food Safety 26:275-301.
Jin GZ & Leslie P (2003). The effect of information on product quality: evidence from restaurant hygiene grade cards. The Quarterly Journal of Economics 118:409-51.
Jones TF, Boris IP, LaFleur BJ, Ingram A, Schaffer W (2004). Restaurant inspections scores and foodborne diseases. Emerging Infectious Diseases 10:688-692.
Jones TF & Grimm K (2008). Public knowledge and attitudes regarding public health inspections of restaurants. American Journal of Preventive Medicine 34:510-513.
Leach J (2003). A guide to customer perception of food hygiene. London: Chadwick House Publishing.
Lee M & Middleton D (2003). Enteric illnesses in Ontario, Canada, from 1997 to 2001. Journal of Food Protection 66:953-961.
Lexington-Fayette County (2008). Restaurant inspection scores. Health Department. Available at: www.lexingtonhealthdepartment.org/ (accessed 14 April 2009).
Mobile County Health Department (2008). Mobile County Health Department restaurant ratings. Available at: http://www.mobilecountyhealth.org/Default.asp?p=’Restaurant‘ (accessed 21 August 2008).
New York City (2008). Restaurant inspection information. New York City Department of Health and Mental Hygiene. Available at: http://www.nyc.gov (accessed 20 June 2008).
North Carolina Administrative Code (2005). Public display of grade card. North Carolina Department of Environmental and Natural Resources, Division of Environmental Health, Environmental Health Services, T15A.18A.2603, 1 April 2005.
Norwalk Health Department (2009). Restaurant ratings. Available at: http://www.norwalkhealthdept.org/resources_restaurants.htm (accessed 14 April 2009).
Office of Environmental Health Services. Food safety. Virginia Department of Health. Available at: http://www.healthspace.ca/vdh (accessed 21 July 2008).
Olsen SJ, MacKinnon LC, Gouldin JS, Bean NH, Slutsker L (2000). Surveillance for foodborne disease outbreaks – United States, 1993-1997. Centers for Disease Control and Prevention. Mortality and Morbidity Weekly Report 49:1-51.
Powell D (2002). Communication of restaurant inspection results, public perception and the correlations between restaurant inspections and incidence of foodborne illnesses. Toronto Public Health Summary Report.
Pytka E & Fellows L (2005). Publicly posted health inspection grade cards. Connecticut General Assembly. Available at: http://www.cga.ct.gov/2005/rpt/2005-R-0403.htm (accessed on 20 April 2009).
Regional Municipality of Niagara (2007). NiagaraInfoDine. Niagara Region Public Health. Available at: http://www.regional.niagara.on.ca/government/initiatives/infodine/NiagaraInfoDine.aspx (accessed 15 July 2008).
Reske KA, Jenkins T, Fernandez C, VanAmber D, Hedberg CW (2007). Beneficial effects of implementing an announced restaurant inspection program. Journal of Environmental Health 69(9):27-34.
Seiver O & Hatfield T (2000). Grading systems for retail food facilities: A risk-based analysis. Journal of Environmental Health 63:22-27.
Simon PA, Phillip L, Grace R, Jin GZ, Reporter R, Aguirre A, Fielding JE (2005). Impact of restaurant hygiene grade cards on foodborne disease hospitalizations in Los Angeles County. Journal of Environmental Health 67(7):32-36.
Spear S (2006). Scores on doors. Environmental Health Practitioner 114(6):8-10.
Teledas Co. (2004) RestaurantWatch.com. Available at: http://www.restaurantwatch.com/ (accessed 20 June 2008).
Todd EDC (1998). Foodborne and waterborne disease in Canada: annual summaries: 1992-93. Polyscience Publications, Laval, QC. Todd and colleagues (2008).
Toronto Staff Report (2002). City auditor 2002 follow-up: Review of food safety program, Toronto Public Health (June 2000). Available at: http://www.toronto.ca/legaldocs/2003/agendas/committees/hl/hl030127/it005.pdf (accessed 3 June 2008).
Williams B & Armendariz A (2007). A recipe for trouble. San Diego Union-Tribune, 22 July 2007. Available at: http://www.signonsandiego.com/news/metro/20070722-9999-lz1n22recipe.html (accessed 18 July 2008).
Wiant CJ (1999). Scores, grades and communicating about food safety. Journal of Environmental Health 61:37-38.
World Health Organization (2007). Food safety and foodborne illness. Available at: http://www.who.int/mediacentre/factsheets/fs237/en/ (accessed 3 June 2008).
Worsfold D (2005). Protecting consumers: a review of hygiene award schemes. British Food Journal 107(3):162-172.
Worsfold D (2006a). The Freedom of Information Act and hygiene inspection reports. British Food Journal 108:904-915.
Worsfold D (2006b). Eating out: consumer perceptions of food safety. International Journal of Environmental Health Research 16:219-229.
Worsfold D & Worsfold PM (2008). ‘Scores on Doors’: hygiene disclosure schemes for consumers. Nutrition and Food Science 38:22-31.
Worsfold D & Worsfold PM (2007). Evaluation food hygiene inspection schemes: ‘Scores on Doors’ in the U.K. International Journal of Consumer Studies 31:582-588.

 Quantitative data included 222,527 food safety inspection records (2007–2014); qualitative data included interviews, observations, and document review. Restaurants were more likely to have violations reduced and grades improved at adjudication when grades were at stake. Moreover, adjudication outcomes were highly sensitive to score differences near grade cut-points. Professional representatives helped restaurants to negotiate the interpretation of rules in the quasi-judicial proceedings, softening rigidity of regulations. Representatives’ expertise was consistent with being “repeat players,” which may distort the use of such forums to ensure justice and fairness.